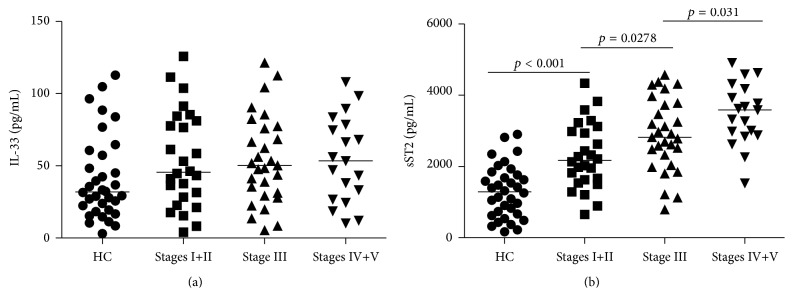
Figure 1.
Analysis of sera IL-33 and sST2 in IgAN patients and HC. The levels of sera sST2 and IL-33 in IgAN patients and HCs were tested by ELISA. Data are expressed as the mean values of individual participants from two separate experiments; horizontal lines represent the median values of different groups. (a) Analysis of serum IL-33 levels revealed no obvious differences among different stage IgAN patients and healthy controls (HC) (all p > 0.05). No significant difference in the levels of serum IL-33 was found among each stage of IgAN patients. (b) Serum sST2 levels were significantly higher in each stage of IgAN patients than in HC and furthermore tended to increase in parallel with the severity of the histopathological classification of IgAN (r = 0.443, p < 0.001).

