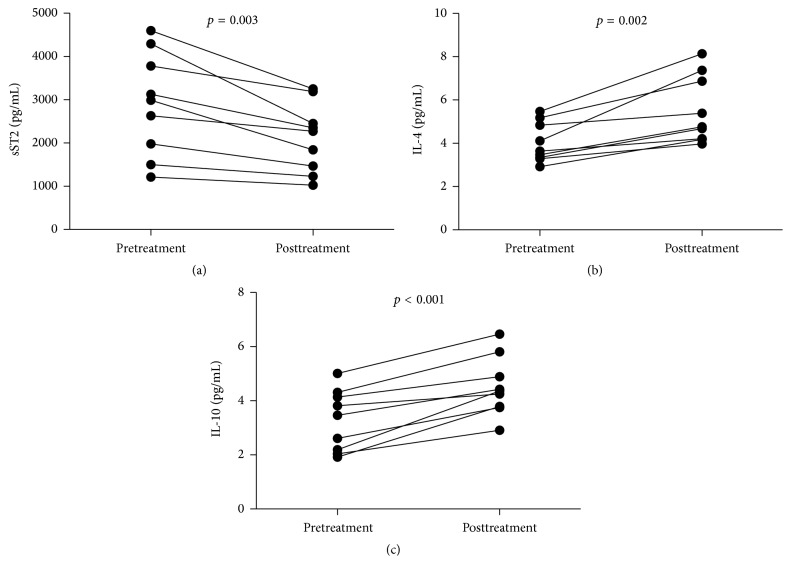
Figure 7.
Levels of serum cytokines in IgAN patients following treatment. The concentrations of serum cytokines were compared in IgAN patients before and after treatment. The data are expressed as the mean % or concentration of individual subjects from two divided experiments. ((a)–(c)) The levels of serum of sST2, IL-4, and IL-10 in individual patients pre- and posttreatment, respectively.

