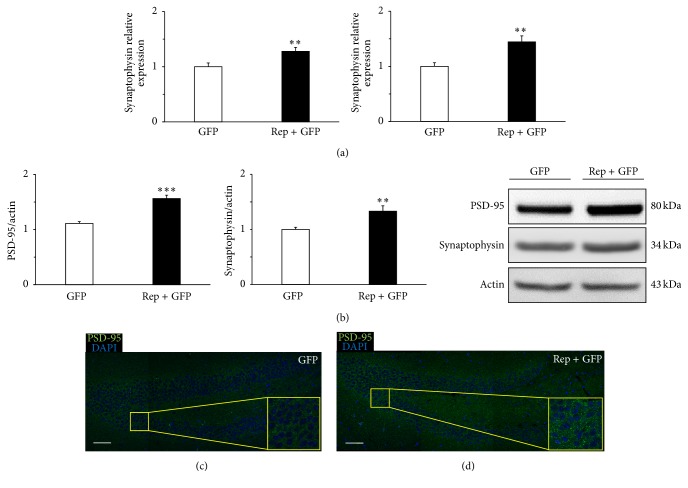
Figure 5.
Synaptic density in the hippocampus increased by in vivo expression of reprogramming factors. The expression levels of the synaptic markers of PSD-95 and synaptophysin in the hippocampus were determined by quantitative real-time reverse transcription-polymerase chain reaction (qRT-PCR) and western blot (n = 3 per group). (a) qRT-PCR analysis confirmed that PSD-95 and synaptophysin levels were significantly higher in the treatment group than the control group (t = 2.879, p < 0.01; t = 3.668, p < 0.01, resp.). (b) Western blot analysis also confirmed that PSD-95 and synaptophysin levels were significantly higher in the treatment group than the control group (t = 6.499, p < 0.001; t = 3.136, p < 0.01, resp.). (c, d) Confocal microscope images are immunohistochemistry results that showed the area of the dentate gyrus in the hippocampus. The expression of PSD-95 in the yellow box represented the difference of synaptic density in the control (c) and treatment (d) group. Scale bars = 50 μm. ∗∗ p < 0.01; ∗∗∗ p < 0.001.

