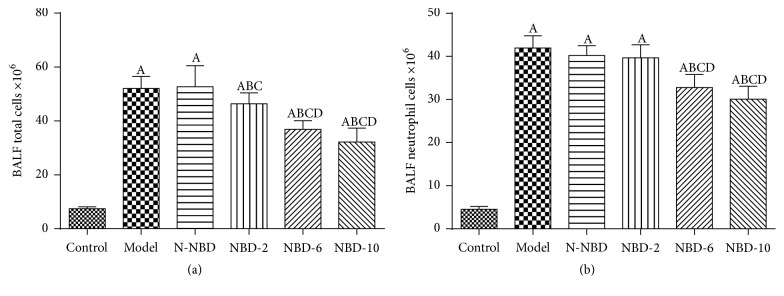
Figure 3.
Effect of NBD on inflammatory cell infiltration in the BALF of mice with ALI. BALF (a) total cell and (b) neutrophil levels were assessed to evaluate inflammatory infiltration. Data are expressed as the mean ± SD (n = 6). A represents versus control group, A P < 0.05; B represents versus model group, B P < 0.05; C represents versus N-NBD group, C P < 0.05; D represents versus NBD-2 group, D P < 0.05.

