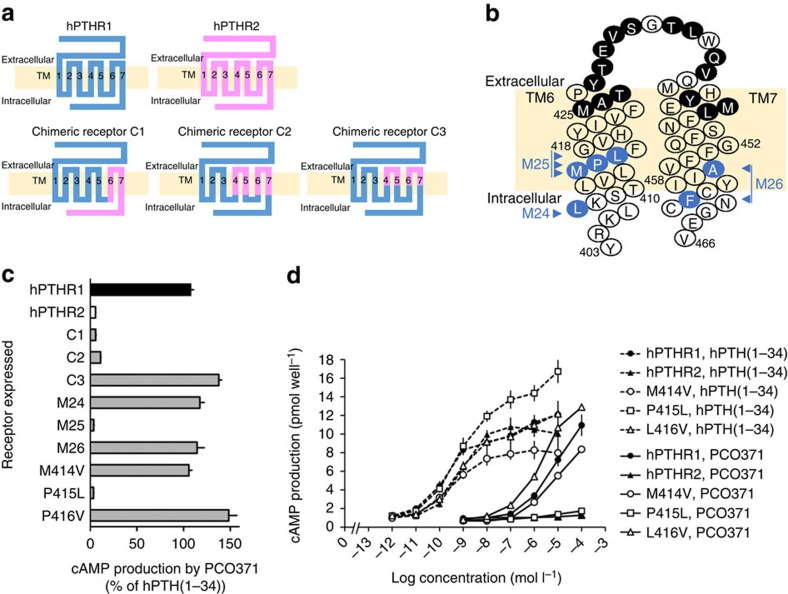
Figure 4. Mutation studies using chimeric receptors of hPTHR1 and hPTHR2.
(a) Schematic structures of hPTHR1, hPTHR2 and chimeric receptors in which blue indicates amino acids comprising hPTHR1 and pink indicates amino acids comprising hPTHR2. C1 is a chimeric hPTHR1 in which the C-terminal region (from 398 to 593) is replaced by the corresponding region of hPTHR2 (from 353 to 550). C2 is a chimeric hPTHR1 in which two regions (from 325 to 390 and from 407 to 461) are replaced by the corresponding regions of hPTHR2 (from 280 to 345 and from 362 to 415). Similarly, in C3 two regions (from 334 to 378 and from 425 to 446) are replaced by the corresponding regions of hPTHR2 (from 289 to 333 and from 380 to 400). (b) Snake diagram of TM regions 6 and 7 of hPTHR1 based on the topological arrangement of class B GPCRs (ref. 4). The amino acid residues of hPTHR1 that were replaced with the corresponding residues of hPTHR2 in C3 (filled black circles) and in mutant receptors M24 (L407), M25 (M414, P415 and L416), M26 (A456 and F461), M414V, P415L and L416V (filled blue circles) are indicated. (c) cAMP production stimulated by PCO371 (0.1 mmol l−1) in COS-7 cells expressing hPTHRs or mutant hPTHR1s, indicated as a percentage of cAMP production stimulated by 0.1 μmol l−1 hPTH(1–34). Data are represented as the mean+s.d. of one experiment (n=3) (d) Stimulation of cAMP production by hPTH(1–34) and PCO371 in cells expressing hPTHR1, hPTHR2 and mutant hPTHR1s. Data are represented as the mean±s.d. of one experiment (n=3).

