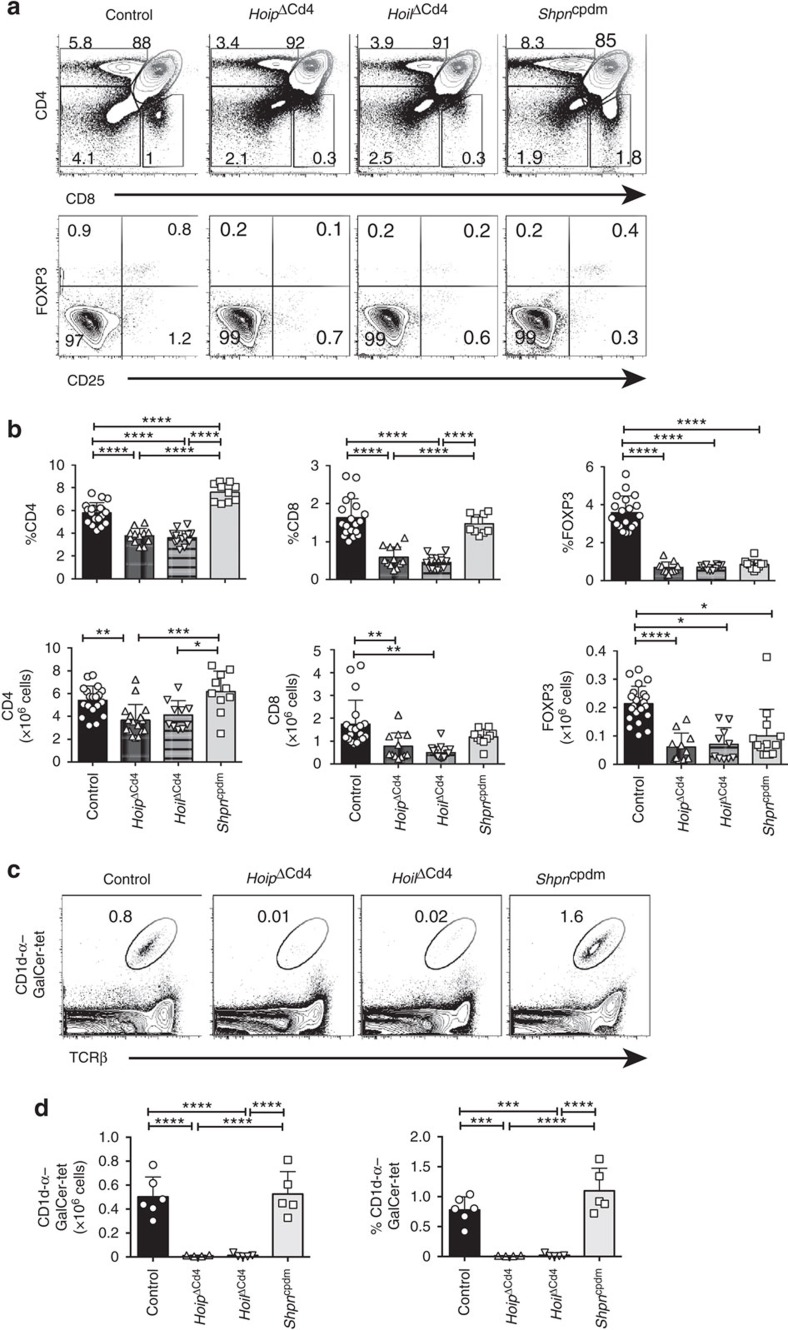
Figure 2. Thymic T-cell differentiation in LUBAC-deficient mice.
(a) Surface staining of CD4 and CD8 (upper panels), and FOXP3 and CD25 (lower panels) on thymocytes from 7- to 15-week-old control, HoipΔCd4, HoilΔCd4 and Sharpincpdm mice. (b) Quantification of total cell numbers and percentages of CD4+ CD8+ and FOXP3+ thymocytes. (c) Flow cytometric analysis of thymic CD1d-αGalCer tetramer-positive NKT cells from 7- to 15-week-old control, HoipΔCd4, HoilΔCd4 and Sharpincpdm mice. (d) Total cell numbers and percentages of CD1d-αGalCer tetramer-positive NKT cells in the spleen. For b and d, each symbol represents an individual mouse; small horizontal lines indicate mean±s.d.; *P<0.05, **P<0.01, ***P<0.005 and ****P<0.001, respectively. One-way analysis of variance with a Tukey's post-hoc test for multiple comparisons was used for statistical analysis. Shpncpdm refers to Sharpincpdm mice. Data are pooled from six independent experiments with two to six mice per group (a,b) or representative of two independent experiments with four to six mice per group (c,d).

