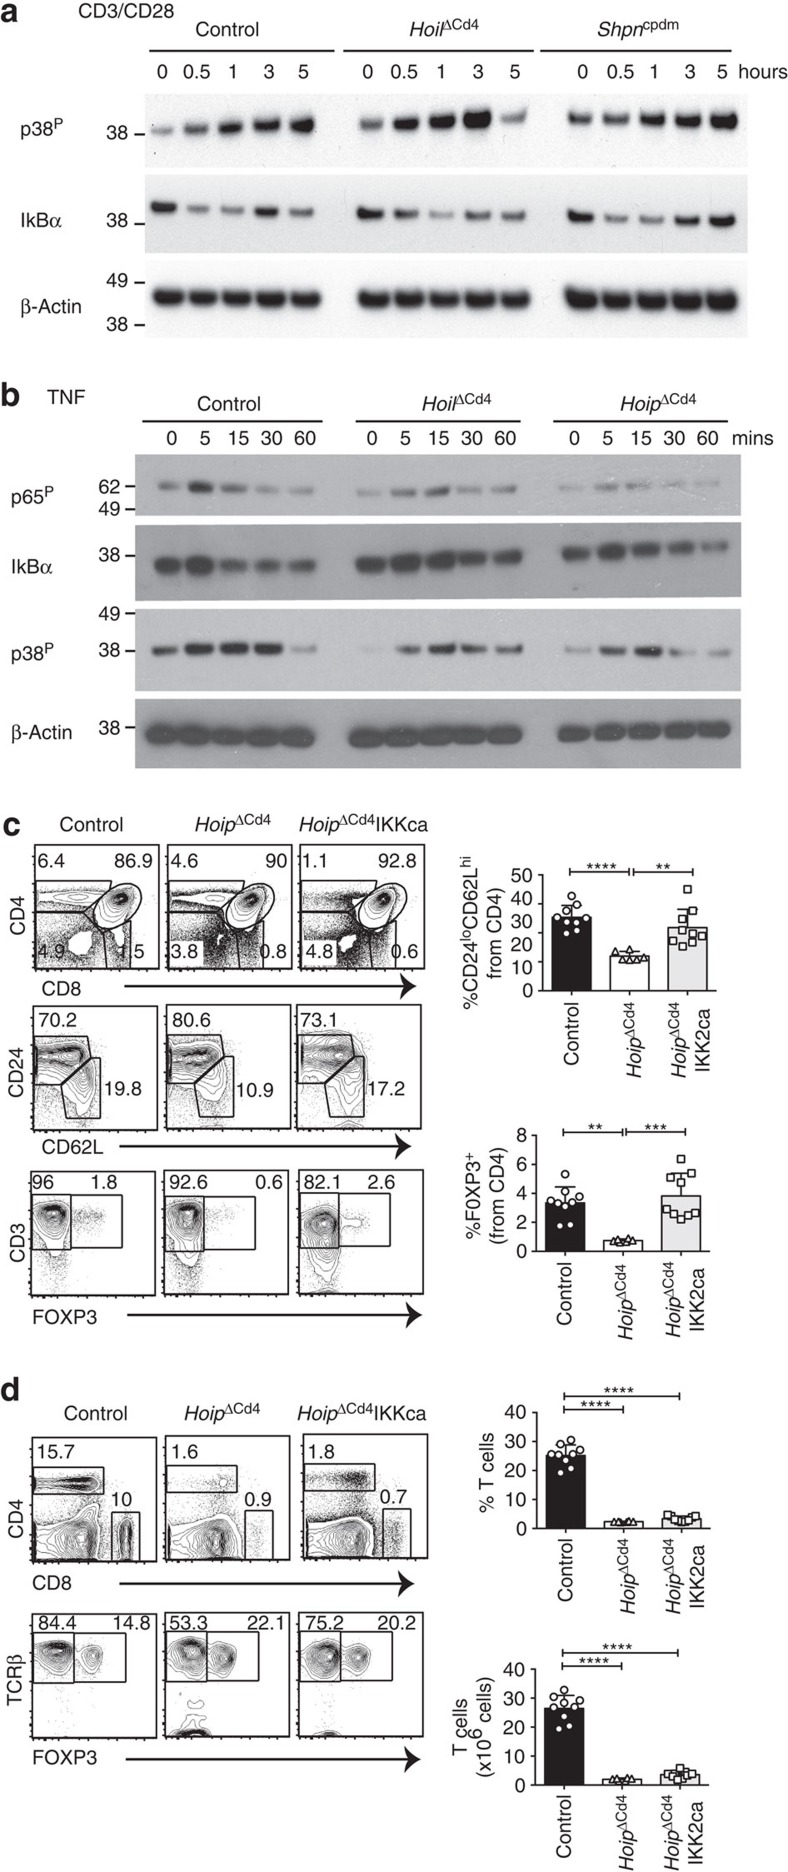
Figure 4. Perturbed TCR or TNFR signalling in LUBAC-deficient thymocytes.
Immunoblot analysis of phosphorylated (activated) p38, phosphorylated (activated) p65 or total IκBα from thymocytes left unstimulated (0) or stimulated with anti-CD3/CD28 for 0.5, 1, 3 or 5 h (a) or with TNF for 5, 15, 30 or 60 min (b). (c) Surface staining of CD4 and CD8 (upper panels), CD24 and CD62L gated on CD4+ cells (middle panels), CD3 and FOXP3 gated on CD4+ cells (lower panels) and numerical quantification of thymocytes from 7- to 15-week-old control, HoipΔCd4 and HoipΔCd4IKKca mice. (d) Surface expression of CD4 and CD8 (upper panels), TCRβ and FOXP3 (lower panels) on splenocytes from control, HoipΔCd4 and HoipΔCd4IKKca mice. For a and b, data are representative of two independent experiments with one mouse per group. For c and d, each symbol represents an individual mouse; small horizontal lines indicate mean±s.d.; *P<0.05, **P<0.01, ***P<0.005 and ****P<0.001, respectively. One-way analysis of variance with a Tukey's post-hoc test for multiple comparisons was used for statistical analysis. Data are pooled from three independent experiments with two to five mice per group (c,d).

