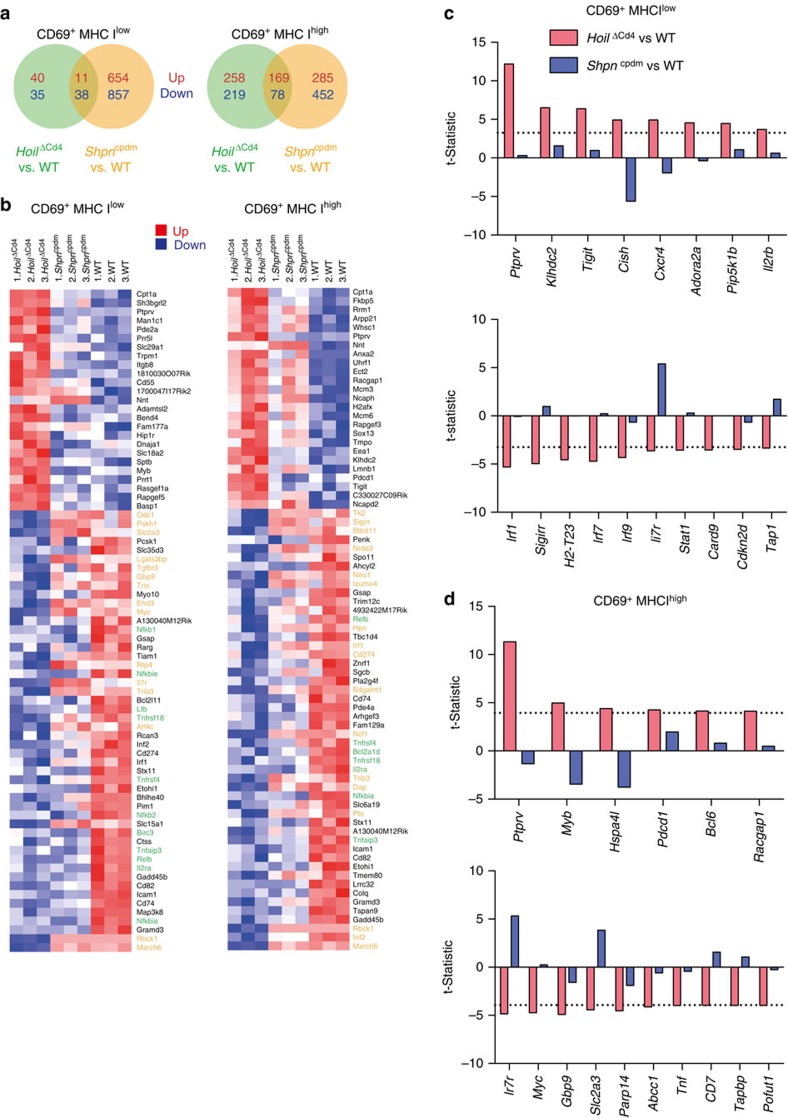
Figure 6. Transcriptional impact of LUBAC deficiency on T-cell differentiation.
(a) Venn diagrams of the numbers of genes upregulated (red) or downregulated (blue) in comparisons of CD69+ MHC Ilow or CD69+ MHC Ihigh thymocytes from HoilΔCd4 versus WT (green) and Sharpincpdm versus WT (orange) at a 5% false discovery rate (FDR) cutoff. (b) Heatmaps of individual log-expression values. Left plot shows the 25 most upregulated genes and 50 most downregulated genes for HoilΔCd4 versus WT in CD69+ MHC Ilow thymocytes. Right plot show the same for CD69+ MHC Ihigh. Genes are ordered by P-value. Red indicates relatively higher expression and blue indicates relatively lower expression. Genes highlighted in green are involved in NF-κB signalling, those in yellow are involved in thymocyte/Treg cell differentiation. Shpncpdm refers to Sharpincpdm mice. (c,d) Genes that are differentially expressed in HoilΔCd4 versus WT but show no change or opposite change in Sharpincpdm. Results for CD69+ MHC Ilow thymocytes are shown in c and CD69+ MHC Ihigh thymocytes in d. The plot shows the limma t-statistics for each gene for assessing differential expression; the dotted line indicates the 5% FDR cutoffs of t=3.25 for c and t=3.94 for d.

