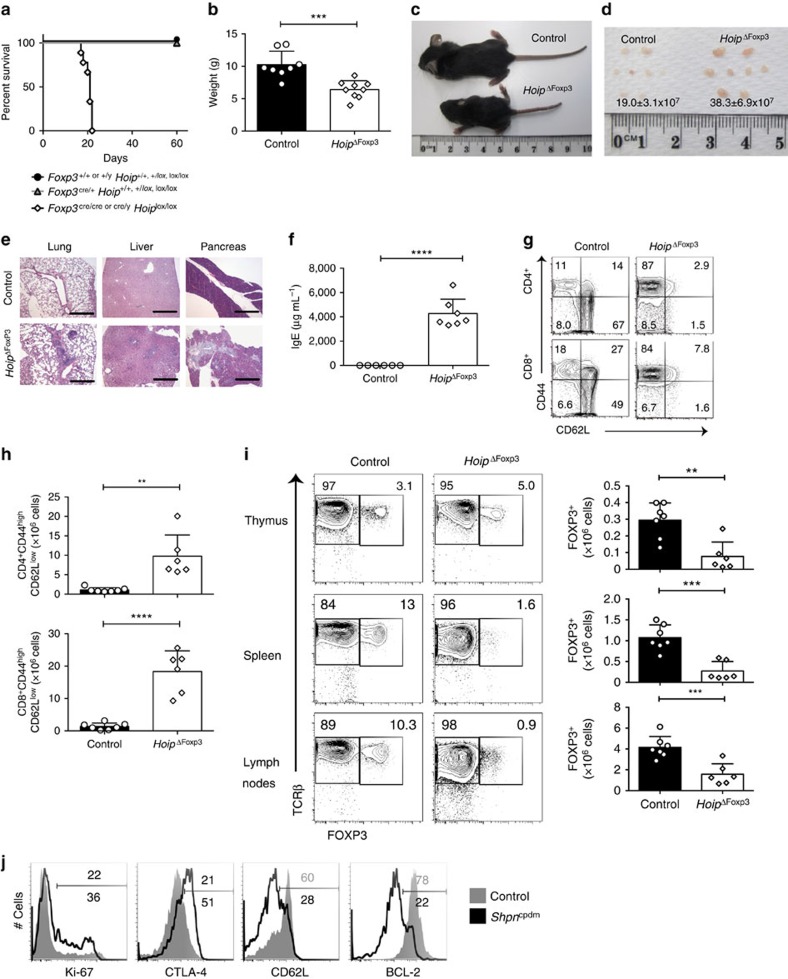
Figure 7. LUBAC is required for peripheral Treg cell homeostasis and tolerance.
(a) Kaplan–Meyer survival curve measured from birth to 60 days for mice of the indicated genotypes (P<0.0001 using the log-ranked Mantel–Cox test). (b) Weights of 18–22-day-old male and female HoipΔFoxp3 mice and healthy littermate controls. (c) Runted appearance and (d) lymphadenopathy observed in HoipΔFoxp3 mice, with mean cell number indicated. (e) Representative hematoxylin and eosin (haematoxylin and eosin) stained sections of lung, liver and pancreas of 21-day-old mice of the indicated genotypes (scale bars, 500 μm). (f) Plasma IgE concentrations in 18–22-day-old HoipΔFoxp3 mice and healthy littermate controls. (g) Expression of CD44 and CD62L on CD4+FOXP3− (top panel) and CD8+ T cells (bottom panel) in spleens of WT and HoipΔFoxp3 mice. (h) Absolute numbers of CD44highCD62Llow activated cells in the CD4+FOXP3− and CD8+ population of WT and HoipΔFoxp3 mice. (i) Representative flow cytometry plots and absolute numbers of FOXP3+TCRβ+ cells in the thymus (top panel), spleen (middle panel) and lymph nodes (bottom panel) of WT and HoipΔFoxp3 mice. (j) Expression of Ki-67, CTLA-4, CD62L and BCL-2 in CD4+FOXP3+ cells in the spleen from WT (grey shaded histogram) and Sharpincpdm (black thick histogram) mice. Shpncpdm refers to Sharpincpdm mice. (n=6–9 per /genotype, bar graphs show mean±s.d.). *P<0.05, **P<0.01, ***P<0.005 and ****P<0.001, respectively. One-way analysis of variance with a Tukey's post-hoc test for multiple comparisons was used for statistical analysis. Data are pooled from (a,b,f,g,h) or representative (c–e) of three independent experiments with one to three mice per group.

