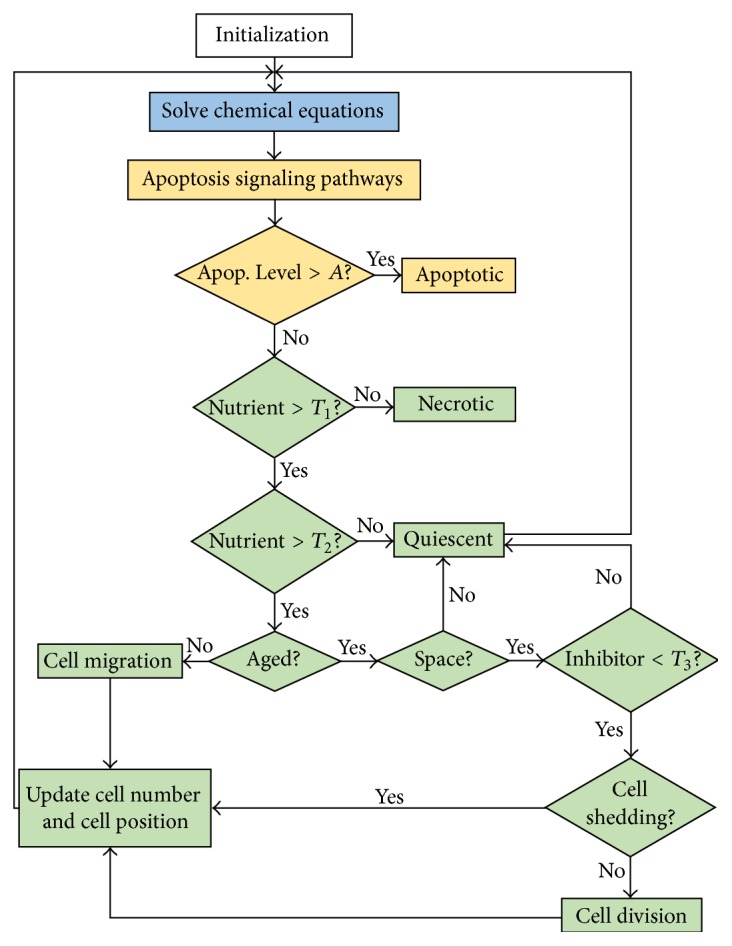
Figure 2.

Flowchart showing the integration of molecular, cellular, and extracellular scales into a sequence of events executed at each iteration. The molecular level processes are shown in yellow, extracellular level process is shown in blue, and cellular level processes are shown in green.
