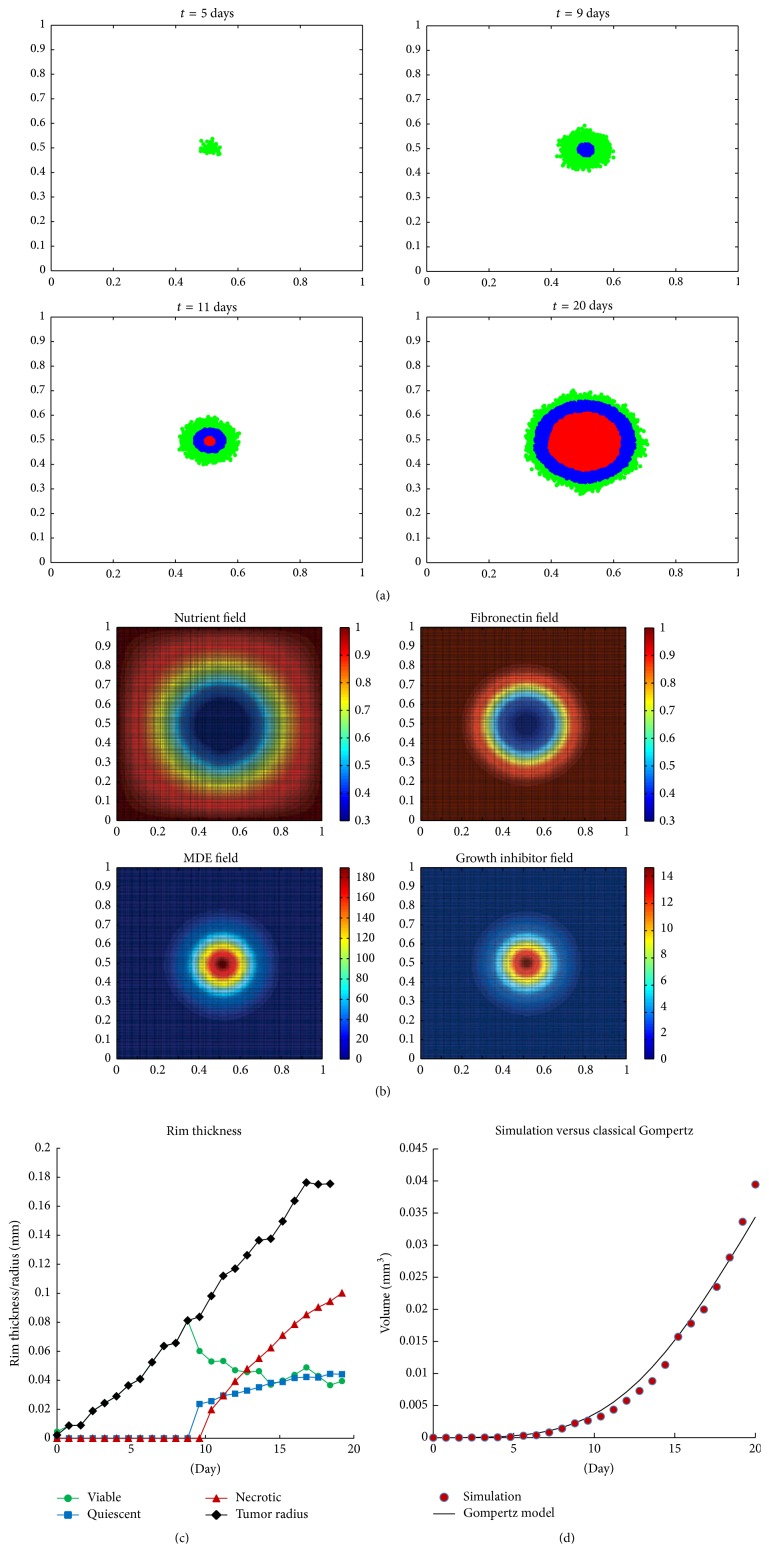
Figure 6.
Simulation result of avascular tumor development without secretome. (a) The evolution of tumor growth patterns at t = 5,9, 11,20 days. Red: necrotic cells; blue: quiescent cells; green: viable cells. (b) The distribution of microenvironmental factors (nutrient, fibronectin, MDE, and growth inhibitory factors) at t = 20 days. (c) The thickness of viable and quiescent rims in comparison with the necrotic core and tumor radii during the first 20 days. ⧫: tumor radius; •: thickness of viable rim; ■: thickness of quiescent rim; ▴: necrotic core radius. (d) The volume as function of time fitted with Gompertz model. The circles are the simulation result and the solid curve is Gompertz curve with parameters A = 1.13 and B = 0.11. These parameter values are found using the least square technique.

