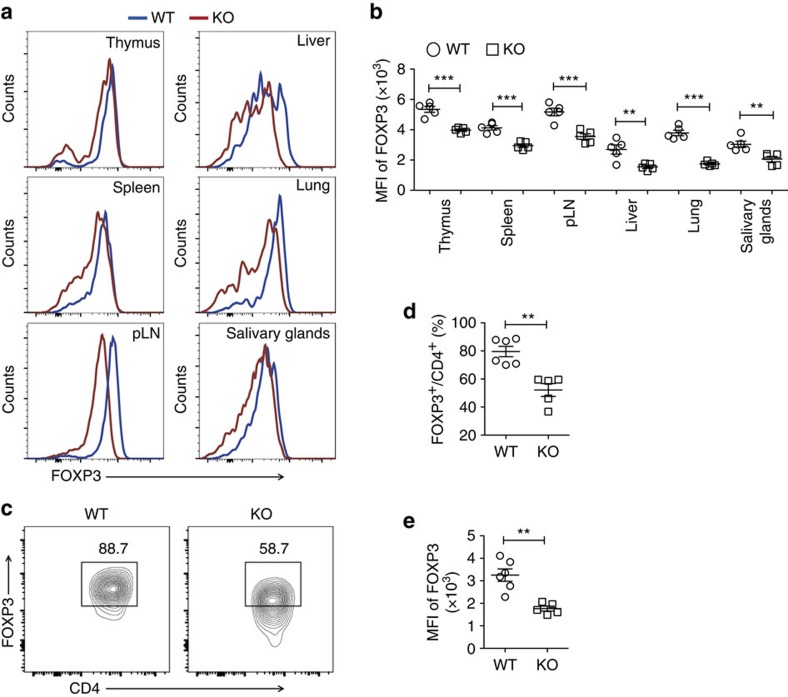
Figure 4. Instability of FOXP3 protein in CD4+YFP+ USP21-ΔTreg cells.
(a) Representative figure shown the expression of FOXP3 protein in CD4+YFP+ Treg cells from the thymus, spleen, pLNs, liver, lung and salivary glands of WT (n=5), and KO (n=5) mice. FOXP3 expression in CD4+YFP+ T cells was shown as histograms. (b) Mean fluorescent intensity (MFI) of FOXP3 among CD4+YFP+ Treg cells indicated in a. (c) WT Treg or USP21-ΔTreg cells were transferred into Rag1−/− mice. The expression of FOXP3 protein was further analysed in transferred Treg cells from the spleen of Rag1−/− mice 7 days later. (d) Percentage of FOXP3+ Treg cells as indicated in c. WT group (n=6) and KO group (n=5), data represent means±s.d. (e) Mean fluorescent intensity (MFI) of FOXP3 among transferred Treg cells as indicated in c. WT group (n=6) and KO group (n=5), data represent means±s.d. **P≤0.01, ***P≤0.001, as determined by Student's t-test. NS, not significant.

