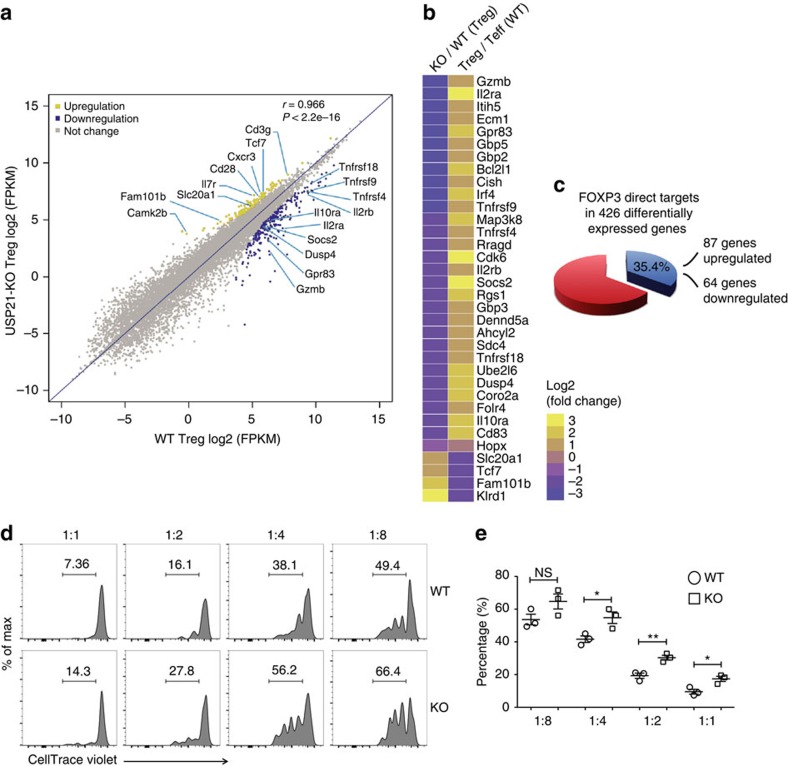
Figure 5. USP21-ΔTreg cells have compromised expression of Treg signature genes and impaired suppressive activity.
(a) Scatter plot of genes significantly upregulated (yellow), downregulated (blue) or unchanged in USP21-ΔTreg cells. The cutoff value was set at fold change≥2 and P value<2.2e−16. (b) Clustering of differentially expressed genes identified in USP21-ΔTreg cells compared with WT Treg cells. Yellow and purple represent high and low levels of expression of the indicated genes, respectively. The colours indicate the value of log2 fold change. (c) Percentage of FOXP3-bound genes that changed in expression in USP21-ΔTreg cells, where published FOXP3 ChIP-seq data sets were used as total FOXP3 target gene coverage. (d) CD4+CD25−YFP− Teff cells were sorted from WT mice and labelled with CellTrace Violet. Labelled responder T cells were then either cultured alone or mixed with varying amounts (as indicated) of CD4+CD25hiYFP+ Treg cells sorted from WT or KO mice. Cell mixtures were stimulated with anti-CD3/CD28 beads and the proliferation of the responder cells was measured three days later. (e) Percentage of proliferated responder T cells was assessed as shown in d. (n=3 for each group). All data represent means±s.d. *P≤0.05, **P≤0.01, as determined by Student's t-test. NS, not significant.

