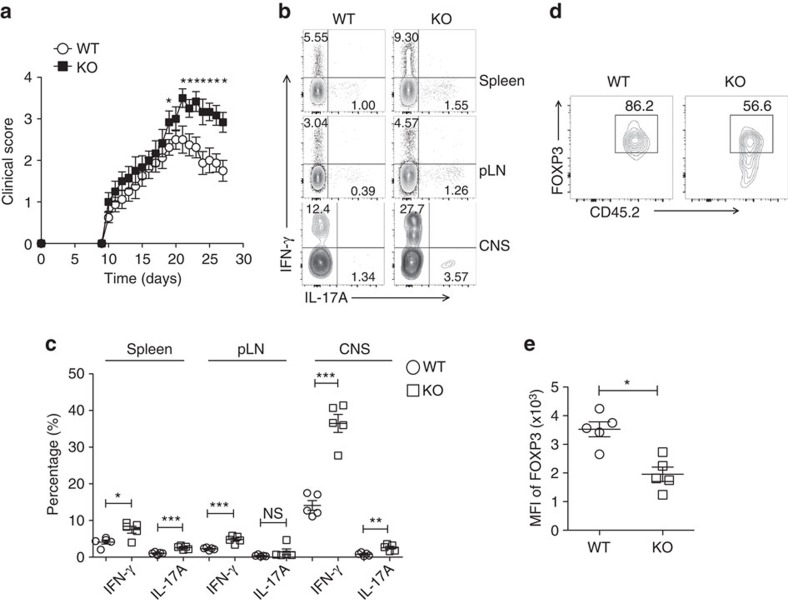
Figure 6. Usp21fl/flFoxp3Cre mice developed more severe EAE symptoms.
(a) Clinical severity of EAE in WT (n=8) and KO (n=7) mice was monitored for 27 days after immunization with MOG peptide. Statistical analysis of the clinical signs was further described in Table 1. (b) Representative figure shown the expression of IFN-γ and IL-17A by CD4+YFP− effector T cells in the spleen, peripheral lymph nodes and CNS from WT (n=5) and KO (n=5) mice on day 27 post EAE induction. (c) Percentage of IFN-γ+ and IL-17A+ cells among CD4+YFP− effector T cells in the spleen, peripheral lymph nodes and CNS from WT (n=5) and KO (n=5) mice as indicated in b. (d) CD45.2+ WT Treg or USP21-ΔTreg cells were transferred intravenously into CD45.1 mice at the onset of EAE (day 12). At the peak of EAE (day 17), the transferred CD45.2+ Treg cells were analysed for FOXP3 expression in the CNS from the CD45.1 mice. (e) Mean fluorescent intensity (MFI) of FOXP3 among transferred CD45.2+ Treg cells as indicated in e. (n=5 for each group). All data represent means±s.d. *P≤0.05, **P≤0.01, ***P≤0.001, as determined by Student's t-test. NS, not significant.

