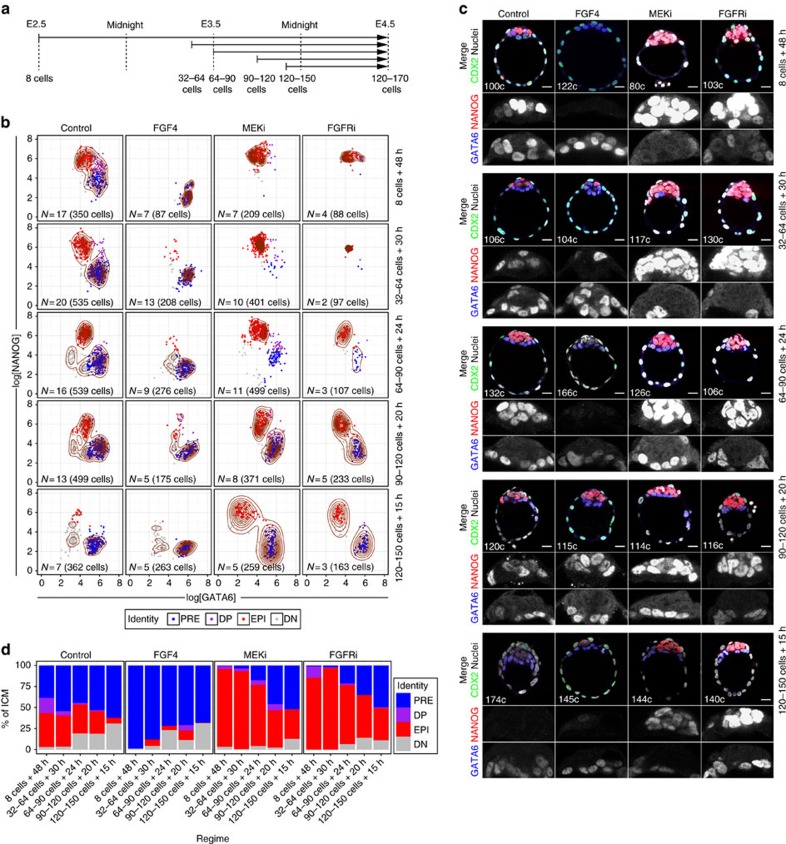
Figure 2. ICM cells become committed to PrE or EPI in an asynchronous manner.
(a) Treatment regimes embryos were subject to. Arrows represent the length of the culture period (in either condition), from embryo collection (beginning of the arrow) to fixation (arrowhead). Developmental stage at the time of collection and fixation are indicated below the arrows. Developmental stage at the time of collection was determined based on that of fixed littermates (shown within Fig. 1 and see Methods). (b) Scatter plots for the levels of GATA6 and NANOG (expressed as logarithm) in individual ICM cells in all embryos at the end of the culture period. Columns represent treatment condition and rows represent treatment regimes as represented in a. Control: KSOM or KSOM+1 μg ml−1 of heparin (addition of heparin had no detectable effect on control embryos); FGF4: KSOM+1 μg ml−1 rhFGF4+1 μg ml−1 of heparin; MEKi: KSOM+1 μM PD0325901; FGFRi: KSOM+1 μM AZD4547. Contour lines have been overlaid as density estimators. Cell identity (colour coded) was assigned using a k-means clustering approach that used the distribution of cells in Control embryos to establish cluster centres (see Methods). Owing to the data distribution, some cells belonging to the PrE in some Control groups were classified as DN. Number of embryos (N) and cells analysed are given on each plot. (c) Representative immunofluorescence images of embryos analysed in b. NANOG (EPI) and GATA6 (PrE) are shown in grayscale in ICM magnifications. In merged image, CDX2 marks the TE lineage and ‘c' indicates the total number of cells of the embryo shown. All images are 5 μm Z-projections. (d) Average ICM composition at the end of the culture period for embryos treated in each of the conditions (Control, FGF4, MEKi and FGFRi) and regime (indicated on the X axis), shown as % of the ICM. Colour coding is indicated. DN, double negative (GATA6−, NANOG−); DP, double positive (GATA6+, NANOG+); EPI: epiblast (NANOG+); PRE, primitive endoderm (GATA6+). For a description of the criteria used to correct fluorescence levels along the Z axis and to determine cell identity, see Methods. Scale bar, 20 μm.

