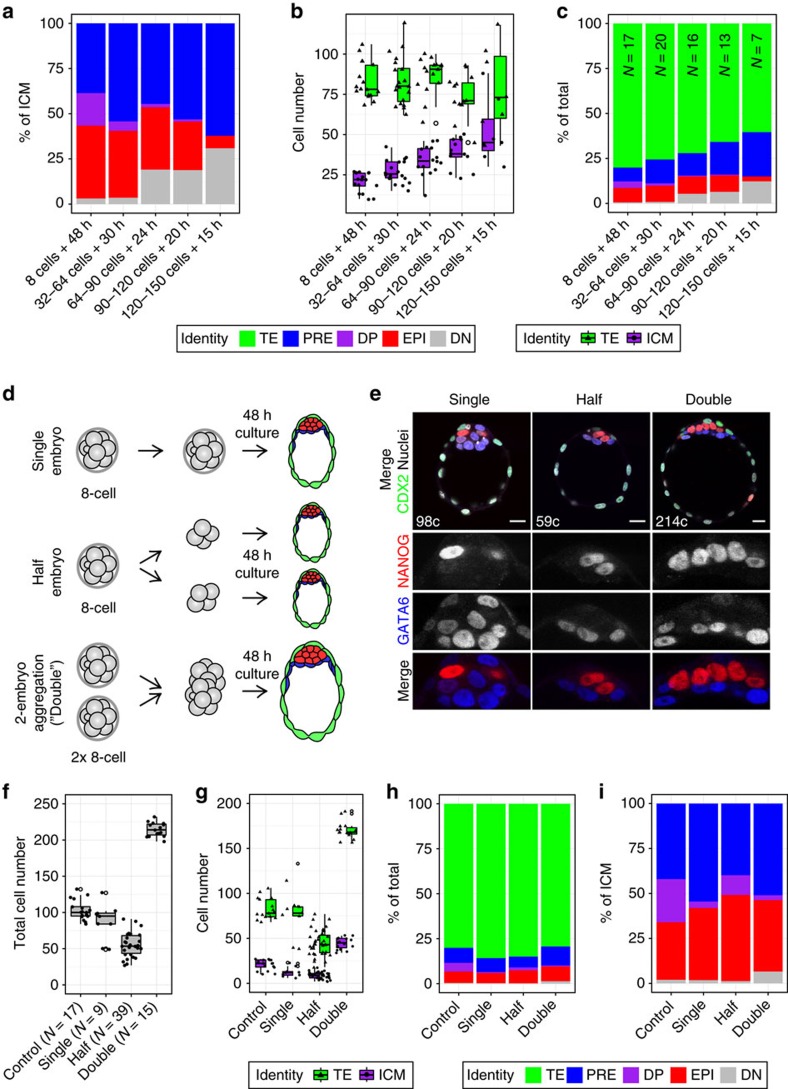
Figure 4. Mouse blastocysts achieve a consistent ICM composition.
(a) Average ICM composition in embryos collected at sequential stages and cultured in control conditions for the time period indicated, as in Fig. 2d. (b) Boxplots showing the number of TE and ICM cells in control embryos shown in a and Fig. 2. Each dot represents the number of TE or ICM cells for one embryo. (c) Average lineage composition for embryos in a,b, and Fig. 2, as % of the total. (d) Diagram depicting generation of blastocysts with half (‘half embryos') and double the number of cells (‘double embryos') using eight-cell stage embryos. Single embryos were eight-cell aggregates for ‘half' embryo experiments and intact, eight-cell stage embryos for ‘double' embryo experiments (e) Representative immunofluorescence images of single, half and double embryos after 48 h in culture. NANOG (EPI) and GATA6 (PrE) shown in grayscale in ICM magnifications and colour coded in merged panel. In top, merged image, CDX2 marks the TE lineage and ‘c' indicates the total number of cells of the embryo shown. All images are 5 μm Z projections. (f) Box plots showing the total cell number of single, half and double embryos after 48 h in culture, as in e. ‘Control' embryos correspond to those shown in a–c and Fig. 2, and are shown for comparison. Number of embryos analysed (N) is indicated. (g) Boxplots showing the number of TE and ICM cells in embryos shown in e,f. Each dot represents the number of TE or ICM cells for one embryo. (h) Average lineage composition for embryos shown in e,f, as % of the total. TE and ICM identity was assigned manually. ICM identity was assigned using the same clusters as in Fig. 2. (i) Average ICM composition for embryos shown in e,f, as % of the ICM. Colour coding is indicated. In boxplots, open circles represent values outside 1.5 × the interquartile range (IQR). DP, double positive (GATA6+, NANOG+); DN, double negative (GATA6−, NANOG−); EPI, epiblast (NANOG+); ICM, inner cell mass; TE, trophectoderm; PRE, primitive endoderm (GATA6+). For a description of the criteria used to correct fluorescence levels and to determine cell identity, see Methods. Scale bar, 20 μm.

