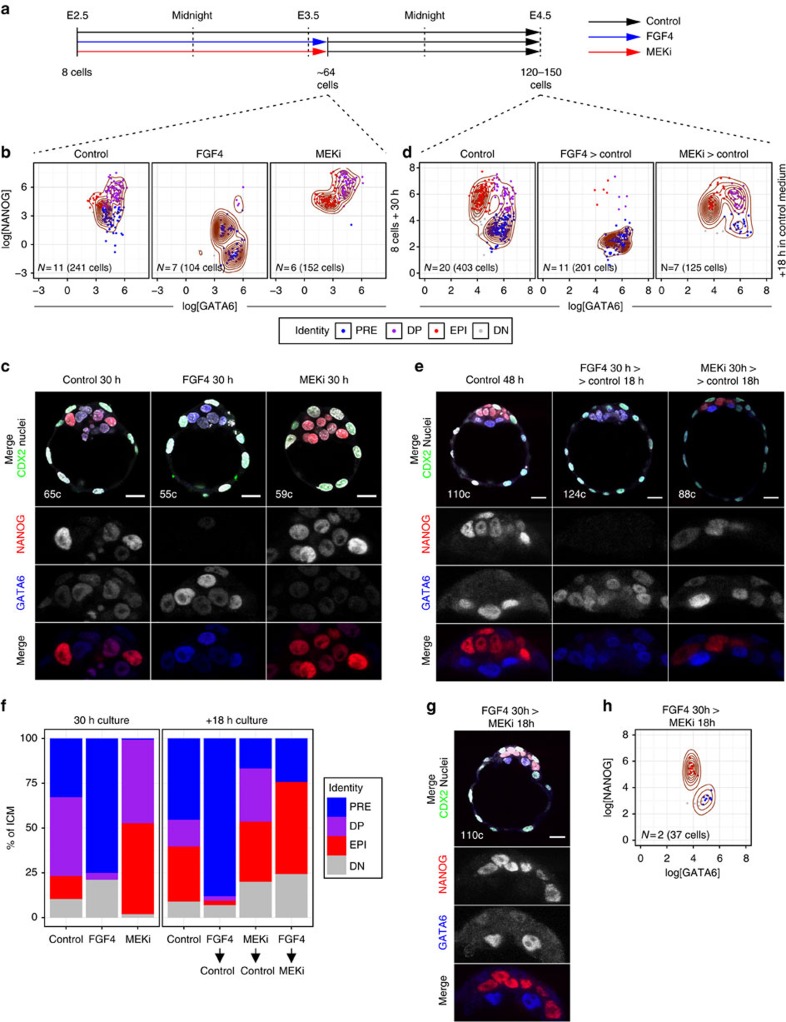
Figure 5. EPI cells trigger PrE specification but not vice versa.
(a) Diagram of the treatment regimes embryos were subject to. (b) Scatter plots for GATA6 and NANOG levels (expressed as logarithm) in individual ICM cells, for each treatment condition after 30 h in culture. Contour lines have been overlaid as density estimators. Control: KSOM or KSOM+1 μg ml−1 of heparin; FGF4: KSOM+1 μg ml−1 rhFGF4+1 μg ml−1 of heparin; MEKi: KSOM+1 μM PD0325901. Cell identity (colour coded) assigned using the same clusters as in Fig. 1d. Number of embryos (N) and cells analysed are indicated in each plot. (c) Representative immunofluorescence images of embryos analysed in b. NANOG (EPI) and GATA6 (PrE) shown in grayscale in ICM magnifications and colour coded in the merged panel. In merged image, CDX2 marks the TE lineage and ‘c' indicates the total number of cells of the embryo shown. All images are 5 μm Z projections. (d) Scatter plots for GATA6 and NANOG levels (as logarithm) in individual ICM cells, after release from FGF4/MEKi and culture in control medium for another 18 h. Contour lines have been overlaid as density estimators. Cell identity (colour coded) was assigned using the same clusters used as in Fig. 2b. Number of embryos (N) and cells analysed are indicated in each plot. (e) Representative immunofluorescence images of embryos analysed in d. (f) Average ICM composition at the end of the culture period for embryos treated in each of the conditions indicated. (g) Representative immunofluorescence images of an embryo treated for 30 h with FGF4 and cultured in MEKi for further 18 h, showing both EPI and PrE layers. (h) Scatter plot for GATA6 and NANOG levels (as logarithm) in individual ICM cells for embryos cultured as in g. Contour lines have been overlaid as density estimators. Cell identity was assigned as in d. Colour coding is indicated. DN, double negative (GATA6−, NANOG−); DP, double positive (GATA6+, NANOG+); EPI: epiblast (NANOG+); PRE, primitive endoderm (GATA6+). For a description of the criteria used to correct fluorescence levels and to determine cell identity, see Methods. Scale bar, 20 μm.

