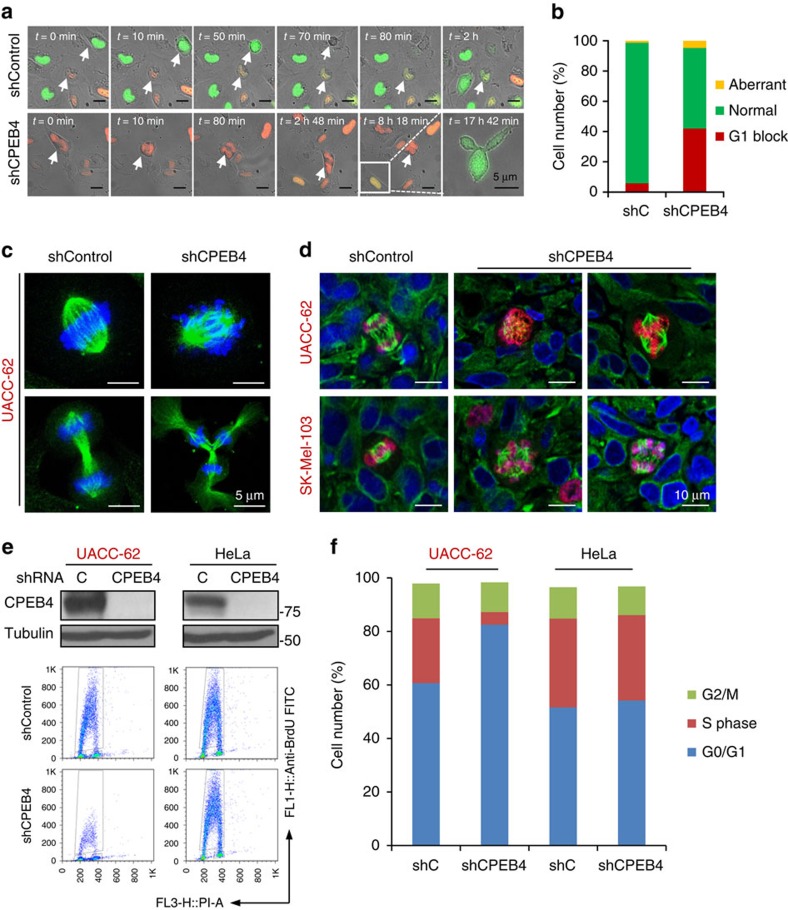
Figure 4. Cell cycle defects in CPEB4-depleted melanoma.
(a) Time-lapse analysis of aberrant mitosis in cell line SK-Mel-103 labelled with RFP-Cdt1 and GFP-Geminin fusion proteins (FUCCI system)41 and transduced with control or CPEB4 shRNAs (see Supplementary Movies 1 and 2 for real time imaging of this process in shC- and shCPEB4-transduced cells, respectively). (b) Quantification of cells undergoing normal or aberrant mitosis or blocked in G1 from experiments shown in a. (c) Confocal imaging of mitotic alterations of cultured UACC-62 melanoma cells expressing control or CPEB4 shRNA. DNA and spindles were visualized by DAPI (blue) and α-Tubulin (green) immunofluorescence, respectively. (d) Aberrant mitosis detected by confocal immunomicroscopy in xenografts generated with UACC-62 or SK-Mel-103 cells expressing control or CPEB4 shRNAs. Proliferating cells were identified by phospho-Histone 3 (red immunofluorescence). DAPI (blue) and α-Tubulin (green) were used to label DNA and spindles, respectively. (e) Cell cycle profiles of UACC-62 and HeLa cells infected with lentiviruses coding for control or CPEB4 shRNA (see depletion in the immunoblots of the upper panels). Shown are flow cytometry plots of the indicated cells processed to visualize BrdU incorporation. (f) Distribution of the indicated cell populations at the different phases of the cell cycle. The percentages of cells at the G0/G1, S or G2/M phases were determined by BrdU and PI staining.

