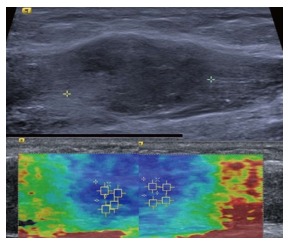
Figure 8.

Intramuscular nodular fasciitis, longitudinal images. The B mode image (upper image) shows that the margins of the lesion are poorly defined and relatively hard to discern. The shear wave velocity elastograms (lower images) show a clear difference in stiffness between the lesion and adjacent normal muscle fibres, as shown by the blue (slow) colour map of the lesion compared with the green and red (faster) colour map of the adjacent muscle fibres.
