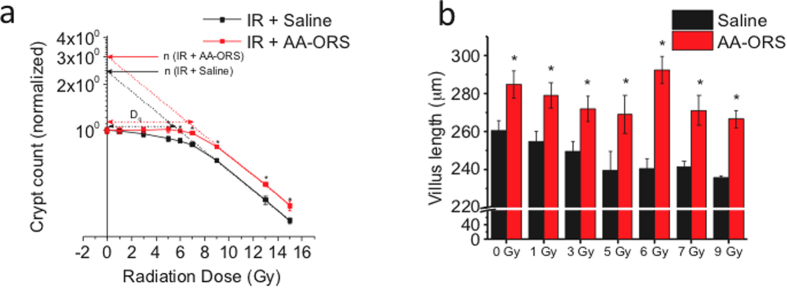
Figure 1. AA-ORS increased crypt count & villus length following irradiation.
Normal saline (saline) was used as a control; saline and AA-ORS were given by gastric gavage. 6 mice per radiation group (0, 1, 3, 5, 6, 7, 9, 13 and 15 Gy) with and without treatment. (a) Semi-log survival curve showing the effect of AA-ORS on crypt count. AA-ORS shifted the graph to the left. The crypt survival curve was modeled using a single-hit, multi-target cell survival model to assess the biological effect. The probability of survival of the mitotic cells in the crypt following radiation was calculated using the equation [S = 1-(1-e^-D/D0)n. S represents the fraction of mitotic cells in the crypts that survived in each of the radiation dose, D represents radiation dose; D0, a measure of the intrinsic radiation resistance of the crypt reproductive units. Dq values for saline treated mice and AA-ORS treated mice are represented by black arrow and red arrow respectively. Dq is calculated from the formula Dq = D0 In n. Without constraining constant cell sensitivity, the N values were 10.4 ± 0.2 and 5.3 ± 0.1 (P < 0.001), indicating a near doubling of progenitor units per circumference from a control. When a constant D0 (4.8 ± 0.1 Gy) was constrained, the difference remained significant at 8.8 ± 0.4 to 6.1 ± 0.3 (P < 0.001). (b) Shows the height of villus following treatment using saline and AA-ORS in irradiated mice. Significant increase in villus height with AA-ORS treated mice compared to mice receiving saline as treatment. Crypts per circumference were counted, and villus length was measured from 10 sections obtained from the ileum. Data are shown as the mean ± S.E.M. for 6 mice per group. *Indicates statistically significant difference (P < 0.01). Normal saline (saline) was used as control and both saline and AA-ORS was given by gastric gavage.

