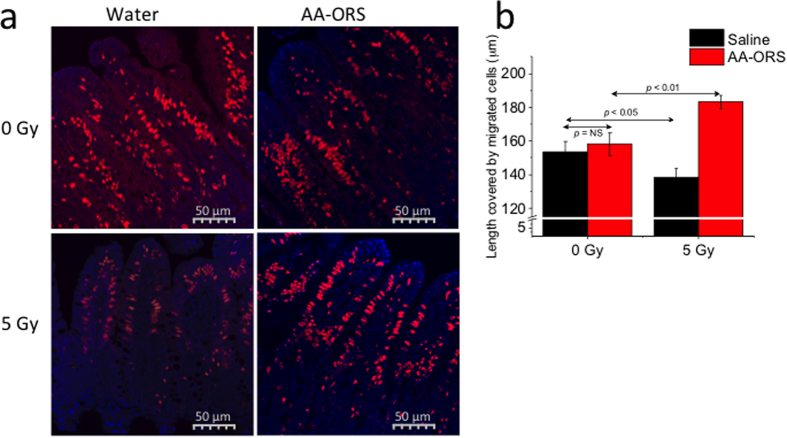
Figure 2.
(a) Confococal microscopy of longitudinal ileal section with prominently stained epithelial cells along the villus length. Paraffin embedded tissues at 5-μm thickness were used. Cell nuclei were stained with DAPI (blue) and EdU+ epithelial cells stained red. Image Pro Plus software was used for measurements of distance migrated by the EdU+ cells along the villus height. Bar – 100 μm. Cells were scored per entire crypt and villus unit. At least 60 crypts and corresponding villi were analyzed per mouse. EdU-labeled cells were normalized to the total cell number per crypt or villus. Minimum of five well-oriented villi were counted per tissue section and the results were averaged. EdU+ cells were seen all the way to the tip of the villus in 5 Gy irradiated tissues but not in AA-ORS-treated mice. (b) EdU+ cell migration distance measured at 72 hours. The 5 Gy irradiated saline-treated mice showed significant decrease in cell migration distance (black bar) compared to 0 Gy. AA-ORS had increased migration distance when compared to irradiated saline treated mice. Values are means ± S.E.M. for 6 mice per group.

