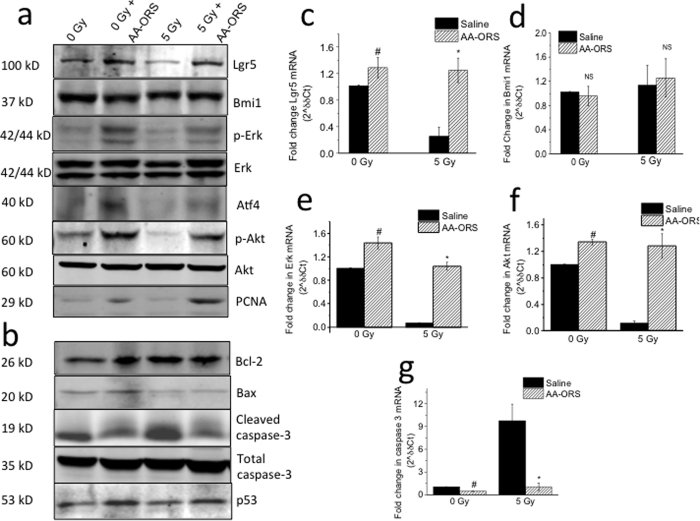
Figure 5. Protein levels and mRNA expression of Lgr5, Bmi1, p-Akt, Akt, p-Erk, Erk in villus epithelial cells from mice treated with saline and AA-ORS following 0 and 5 Gy irradiation.
Immunoblots were repeated four times and q-PCR were repeated 6 times. (a) Western blot analysis for stem cell and proliferation markers (Lgr5, Bmi1, p-Akt, Akt, p-Erk, Erk and PCNA). The protein band of interest was normalized to the total amount of protein in each lane using Coomassie blue stain. (b) Western blot analysis for apoptotic proteins (Bcl2, Bax, cleaved caspase-3, caspase-3 and p53). (c) Lgr5 mRNA levels in mice treated with saline or AA-ORS and 0 Gy or 5 Gy radiation. (d) Changes in Bmi1 mRNA levels in mice treated with saline or AA-ORS and 0 Gy or 5 Gy. (e) Changes in Erk mRNA levels in mice treated with saline or AA-ORS treatment and 0 Gy or 5 Gy. (f) Changes in Akt mRNA levels in mice treated with saline or AA-ORS treatment and 0 Gy or 5 Gy. (g) mRNA expression for caspase-3. Values are means ± S.E.M from n = 6 different mice repeated in triplicates. #P < 0.05 and *P < 0.001 compared with saline control.

