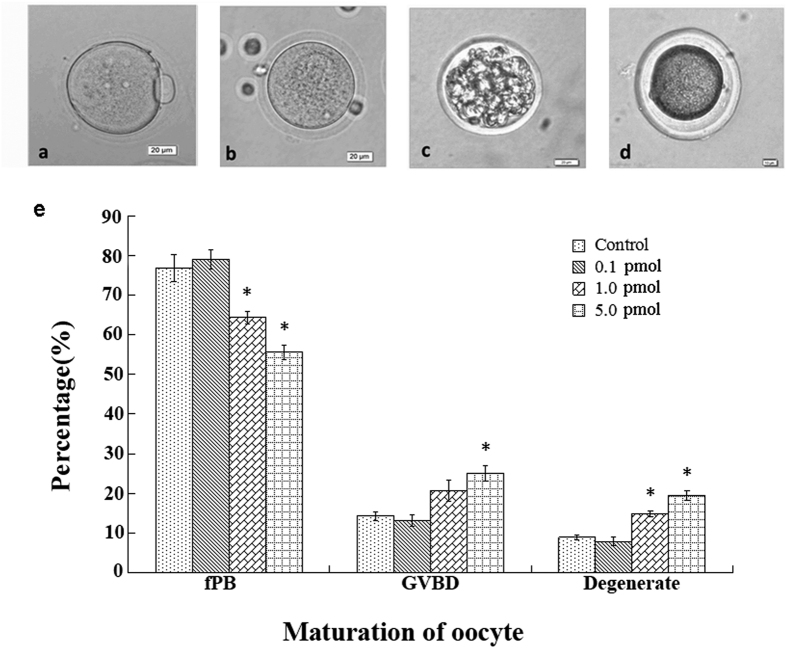
Figure 5. The effect of QDs on oocyte maturation.
(a–d) Typical oocytes obtained from the mouse oviduct ampulla treated with 5.0 pmol QDs. (a) matured oocyte with fPB, (b) GVBD oocyte, (c,d) degenerated oocyte. Scale bar: 20 μm. (e) The statistic data of oocyte maturation. The data was presented as the percentage mean ± SD. (control, n = 112; 0.1 pmol, n = 114; 1.0 pmol, n = 101; 5.0 pmol, n = 108).

