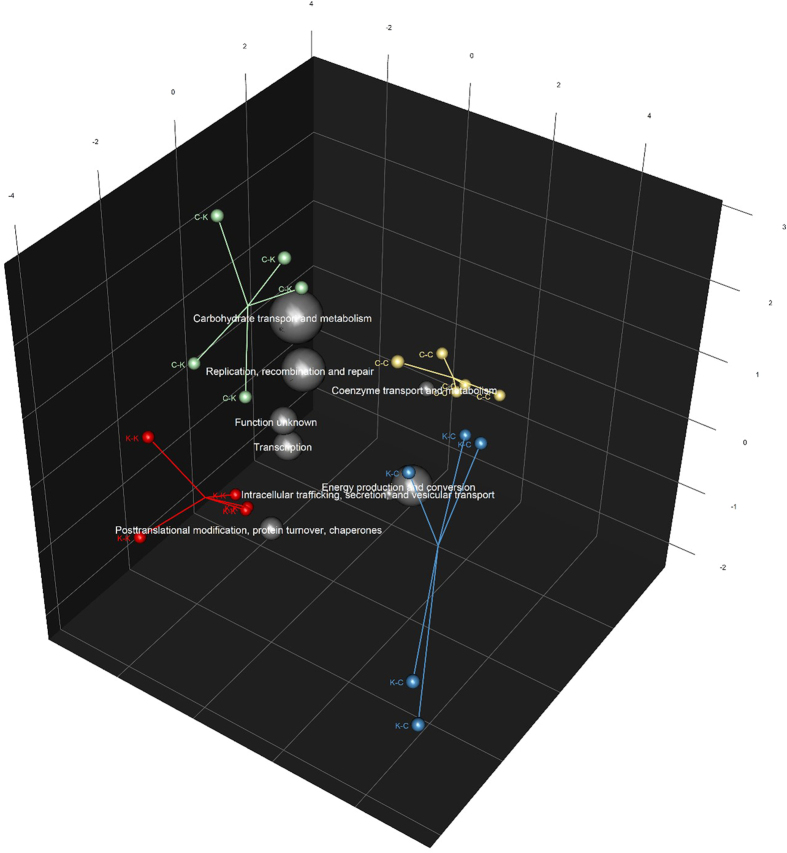
Figure 2. Scores biplot from partial least squares discriminant analysis (PLS-DA) of kittens’ faecal metagenome COG-predicted functional classifications.
The first letter indicates the mother’s diet during pregnancy and lactation and the second letter indicates the kitten’s diet; canned (C) or kibbled (K). Lines converge at the spatial centroid for each treatment group. Grey spheres show the COG functions that best discriminate the groups from each other. The size of the spheres are proportional to the relative abundance of that COG function. The spatial position of each COG function is plotted as a weighted average of the coordinates of all samples. Diet K-Diet K (K-K) n = 3 females, n = 2 males. Diet C-Diet K (C-K) n = 3 females, n = 2 males. Diet K-Diet C (K-C) n = 3 females, n = 2 males. Diet C-Diet C (C-C) n = 4 females, n = 1 male.

