
Figure 2. Forest plot of ORs with 95% CI of TB risk associated with the MBL2 rs1800450 (A > B) gene polymorphism for overall population.
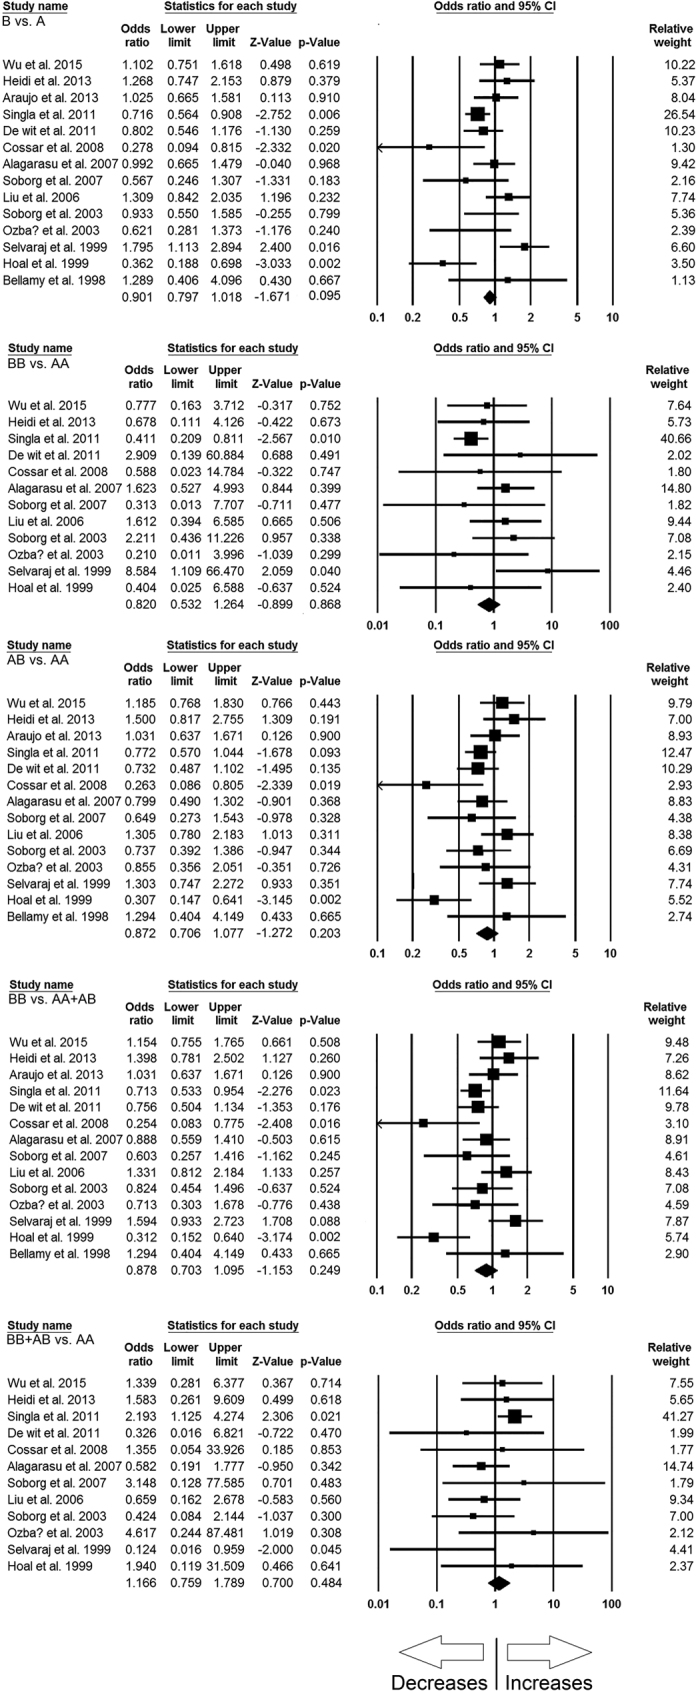
Black square represents the value of OR and the size of the square indicates the inverse proportion relative to its variance. Horizontal line is the 95% CI of OR.