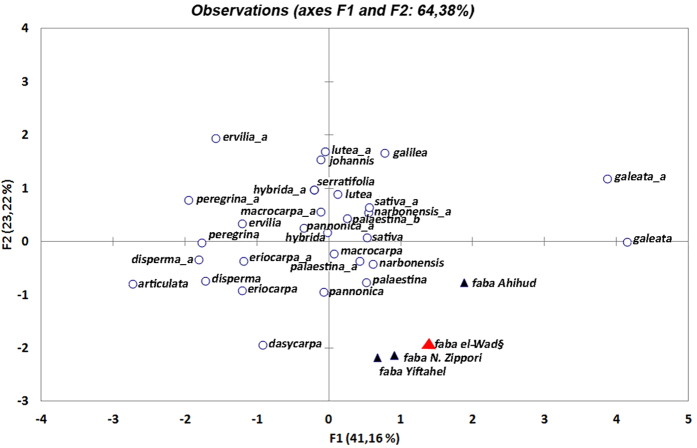
Figure 4. Plot of Principal Component Analysis (PCA) of the major Vicieae specimens.
The plot shows analogies and differences between the faba bean from el-Wad ( ), those from Ahihud, Nahal Zippori and Yiftahel (▲) and modern wild species native to Western Asia (○). The letters_a and_b are used to distinguish different seed and hilum outlines, within the same species. PCA axes 1 and 2 account for 65% of the cumulative variance. PCA axes represent respectively, the seed outline and the hilum relative length. For details, see Supplementary Table S3. Data for the modern species are from Zohary17, Gunn20 and Perrino et al.21. The plot was obtained using XLSTAT.

