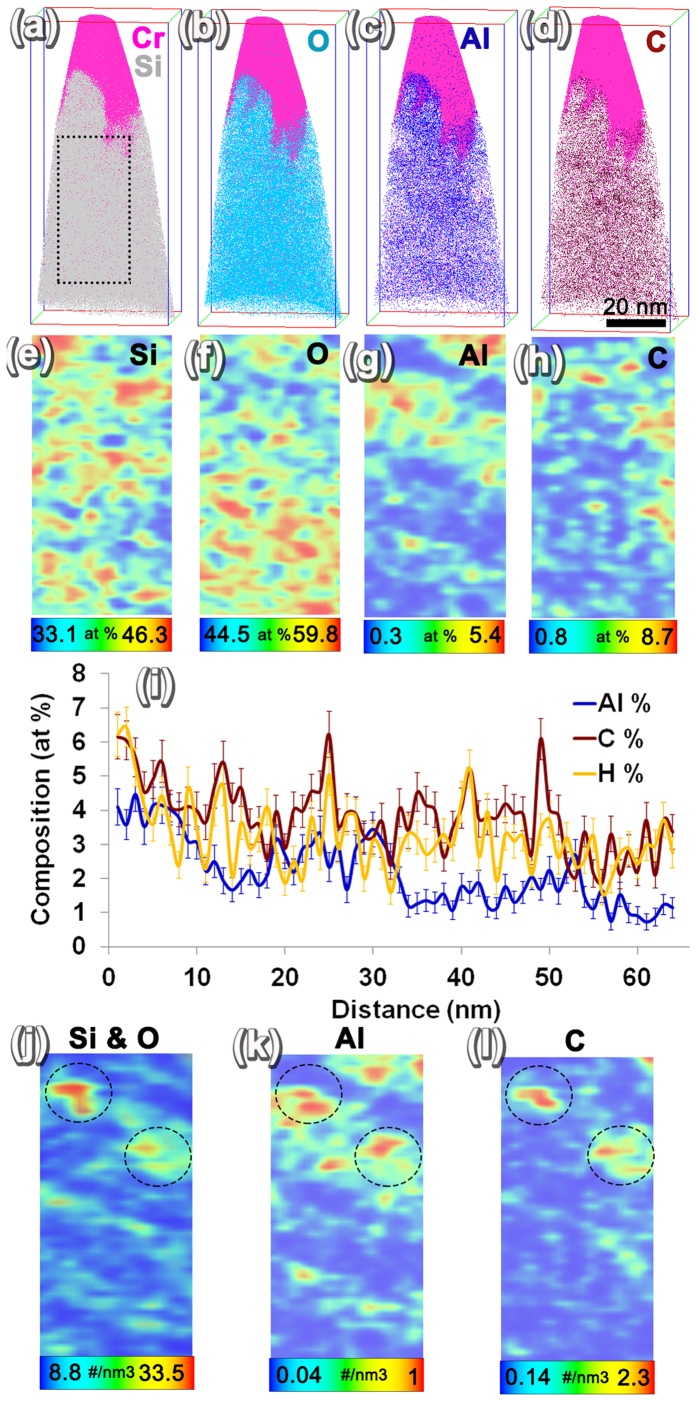
Figure 5. APT results of spent HZSM-5.
Ion maps showing the Cr cap in pink along with (a) Si, (b) O, (c) Al, and (d) C. 2D ion maps plotted using a 1 nm × 25 nm × 50 nm slice of the APT reconstruction show the (e) Si, (f) O, (g) Al, and (h) C distribution. The scale bar is given below each image to show the concentrations corresponding to maximum and minimum composition values. (i) 1D concentration profile from the surface of the HZSM-5 to the bulk plotted using a 10 nm diameter cylinder showing changes in average Al, C, and H concentration. The ion densities of (j) Si and O, (k) Al, and (l) C are compared showing the spatial correlation.

