
Figure 14. Bifurcation diagram showing the extrema of the mean of excitatory and inhibitory neuronal populations, PY and IN1.
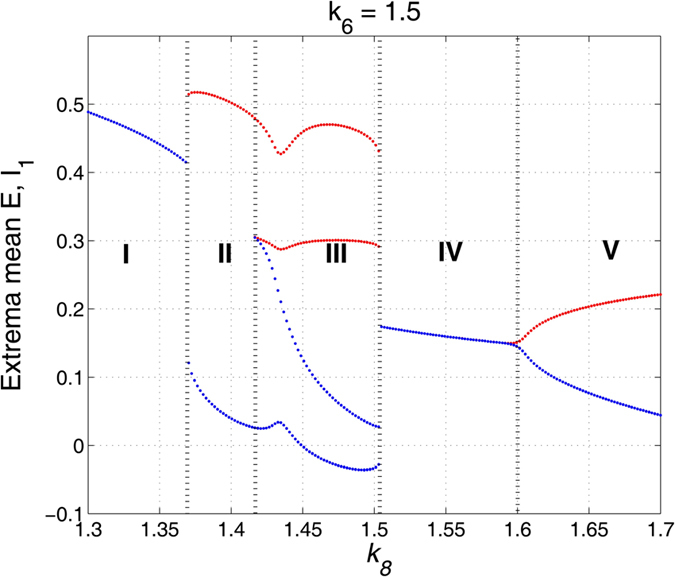
(a) The state transition diagram as the k8 varying in [1.3, 1.7] with k6 = 1.5, corresponding to the upward pink arrow in Fig. 13(a). The system transits from high saturated firing denoted by ‘I’ to clonic oscillations (II), SWD discharges (III), low saturated firing (IV) and to the simple tonic oscillation (V).