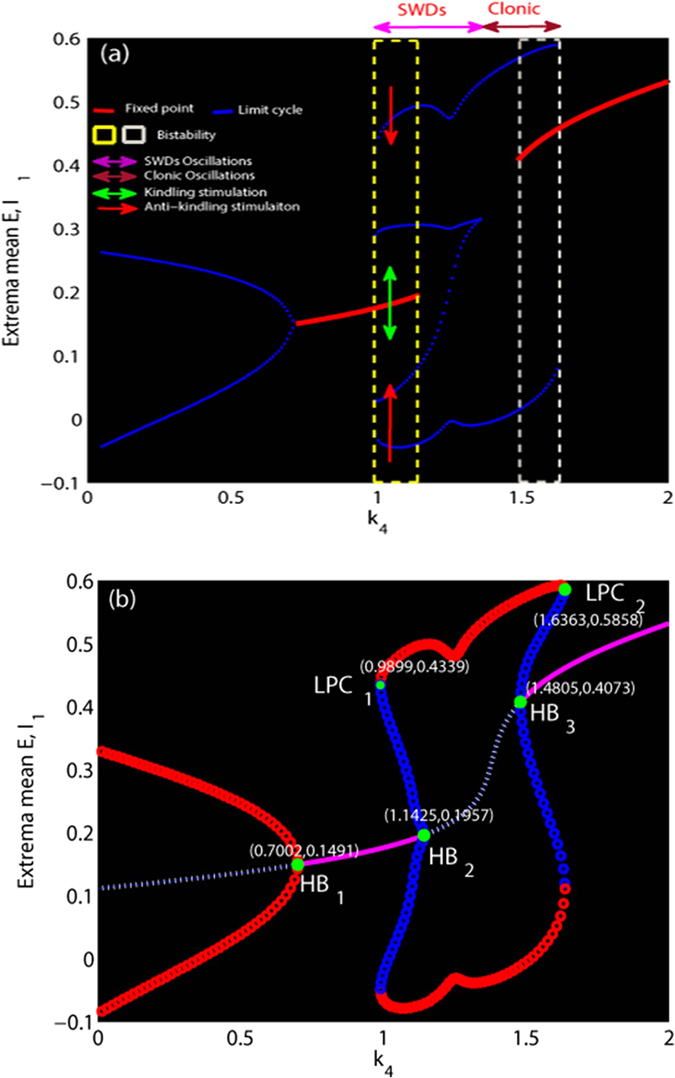
Figure 7. Bifurcation diagram.

(a) Minima and maxima of time series for different values of k4. The blue and red lines represent the limit cycle and fixed point, respectively. The region indicated by yellow dashed rectangle represents the bistable parameter region between non-seizure and SWD states. The region indicated by white dashed rectangle represents the bistable region between non-seizure and clonic states. Pink and purple double arrows correspond to the SWD and clonic oscillations. Green double arrow indicates the kindling stimulation performed on the background resting state (stable focus) and the red arrow indicates the anti-kindling stimulation for the SWD discharges. (b) For the much small values of k4, there is one ustable focus and one stable limit cycle, all simulations converge to the simple tonic oscillations (stable limit cycle). The tonic oscillation disappears and evolves into the low saturated firings following a supercritical Hopf bifurcation (HB1). A bistable region exists with the stable focus and the stale limit cycle following a fold of cycles bifurcation (LPC1). The monostable SWD discharges and clonic oscillations exist following the subcritical Hopf bifurcation (HB2). Beyond the reappearance of the stable focus due to the subcritical Hopf bifurcation (HB3), another bistable region occurs. For much large values of k4 the bistable region disappears due to the second fold limit cycle bifurcation (LPC2).
