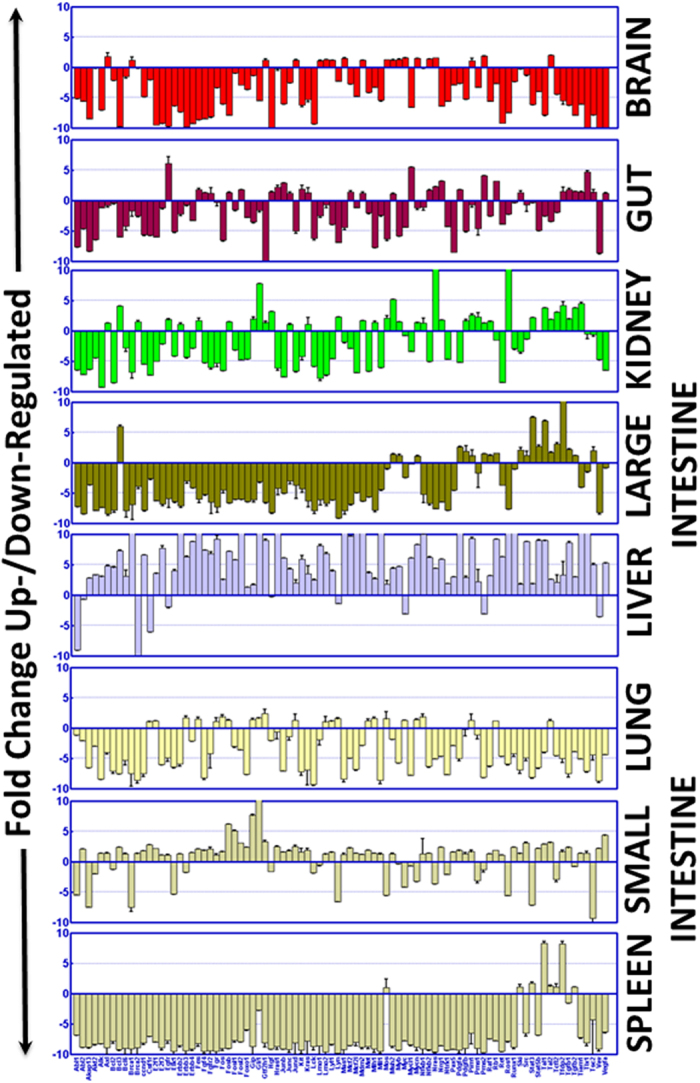
Figure 1. Histograms obtained from the quantitative QPCR profiling showing transcriptional modifications of 88 oncogenes in mouse brain, gut, kidney, liver, lung, spleen, and large and small intestine in response to HZE 56Fe particle radiation exposure.

A custom-made transcriptome profiler with an archive of a unique oncogene profile pertaining to interacting functional networks of oncogene addiction that govern cellular signaling and drive the initiation of carcinogenic processes was used. Individual gene expression levels were background subtracted. The inter-profile variations are normalized with internal positive/housekeeping controls. The relative expression level of each gene is expressed as fold change compared with the mock-IR controls (mean and SD). Group-wise comparisons were made using GraphPad PRISM. For ease of comparison, all genes investigated, irrespective of their expression status, are included in the graph.
