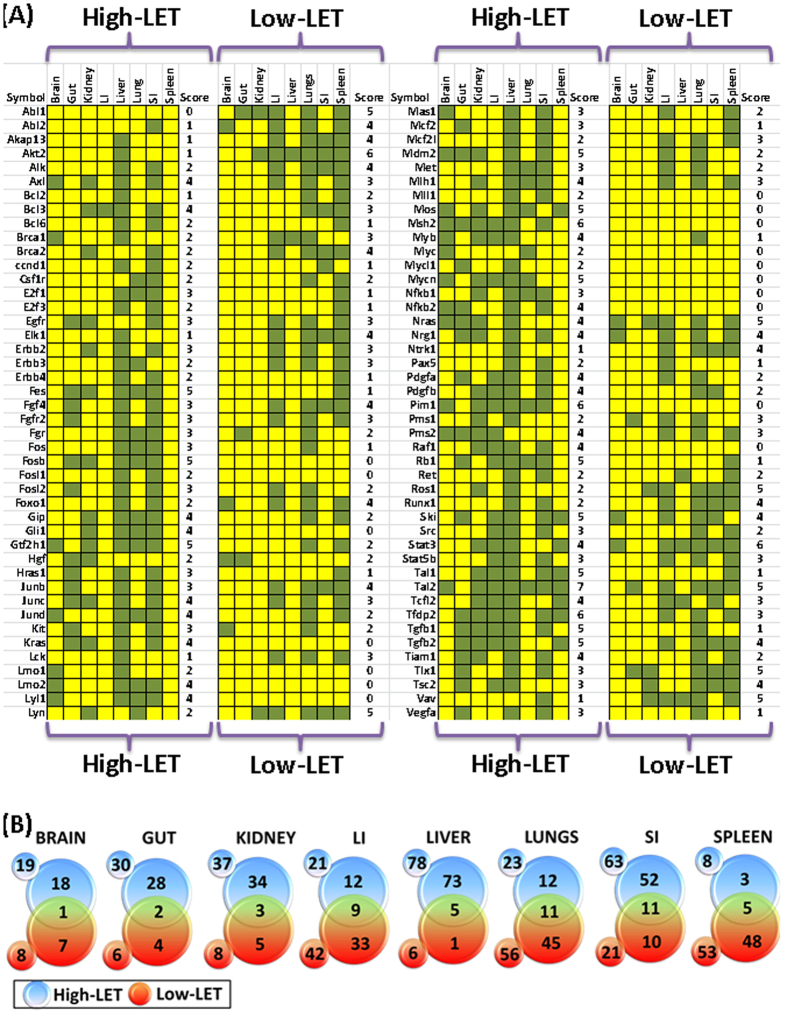
Figure 2.
(A) Heat map showing the transcriptional expression status of each oncogene across the tissues investigated after HZE particle radiation or low-LET radiation, arranged in alphabetical order. The tissue scoring and expression of each oncogene in numerous tissues were also included. HZE particle radiation resulted in the heightened transcription of TAL2 in seven of the 8 tissues investigated. Green: activated transcription; Yellow: non-activated or decreased transcription. (B) Venn diagrams constructed from High-LET: low-LET radiation crisscross analysis of activation sustained oncogenes in brain, gut, kidney, large intestine (LI), liver, lungs, small intestine (SI) and spleen showing exclusive HZE ion exposure response. Numbers in small circles outside the Venn diagram = total number of oncogenes activated in response to high/Low-LET radiation; numbers in bigger circles = genes activated exclusively in response to high/low-LET radiation; numbers in overlapping region = genes activated in common between high- and low-LET radiation.

