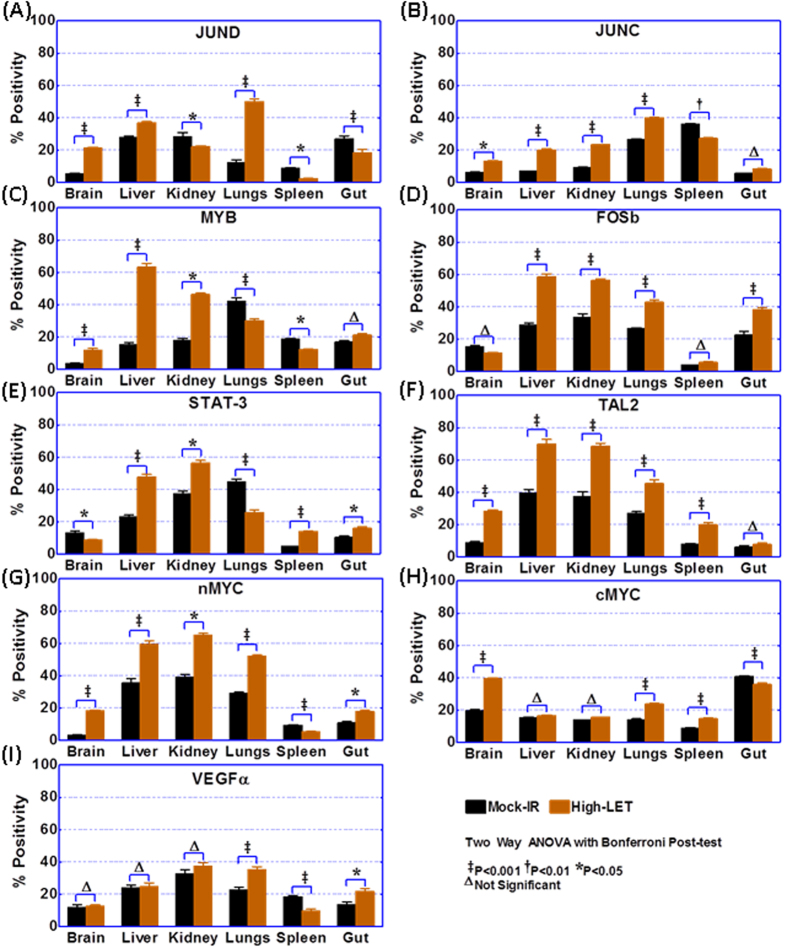
Figure 4.
Histograms showing the expression levels of (A) JUND, (B) JUNC, (C) MYB, (D) FOSb, (E) STAT3, (F) TAL2, (G) MYCN, (H) cMYC, and (I) VEGFα in brain, liver, kidney, lung, spleen, and gut tissues from mice that were either mock-irradiated or exposed to whole body HZE particle radiation. Quantification of the corresponding cytoplasmic/nuclear/total positivity was performed using Columbus image data analysis from Operetta high content IF confocal imaging. The primary protein was tagged with secondary Ab tagged with Alexa Fluor-488®, while the cell membrane was marked with WGA-Alexa Fluor-594® and nuclear counterstained with DAPI. Group-wise comparisons were performed in GraphPad Prism using two-way ANOVA with Bonferroni’s post-hoc correction.

