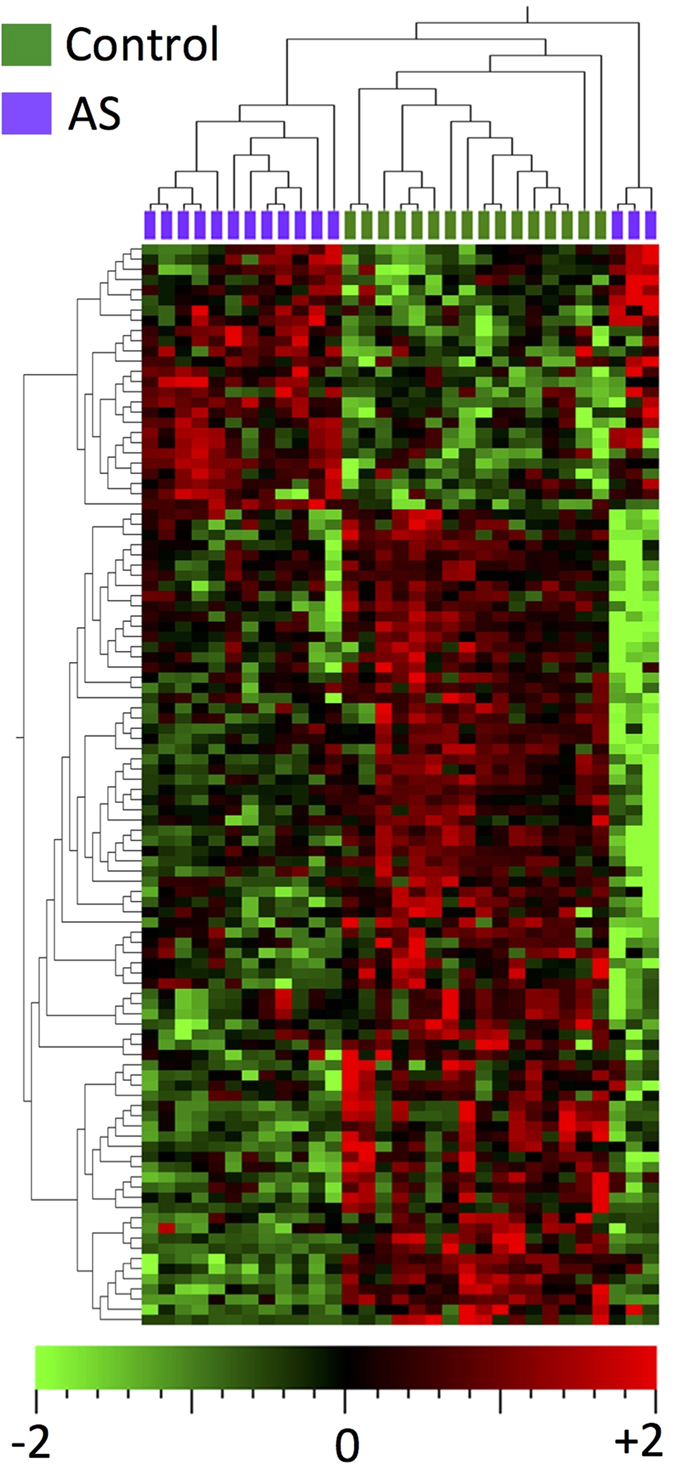
Figure 1. Heatmap of differentially expressed miRNAs in aortic stenosis (adjusted p-value <0.05).

Hierarchical clustering shows clear grouping according to presence or absence of aortic stenosis. The aortic stenosis samples to the right of the figure are outliers on the principal components analysis plot (Supplementary Figure 1 and Supplemental movie), but still cluster with other aortic stenosis samples on the first principal component. The miRNAs are listed in Supplementary Table 1.
