
Figure 4. Optimal combination of primary and secondary frequency band oscillation.
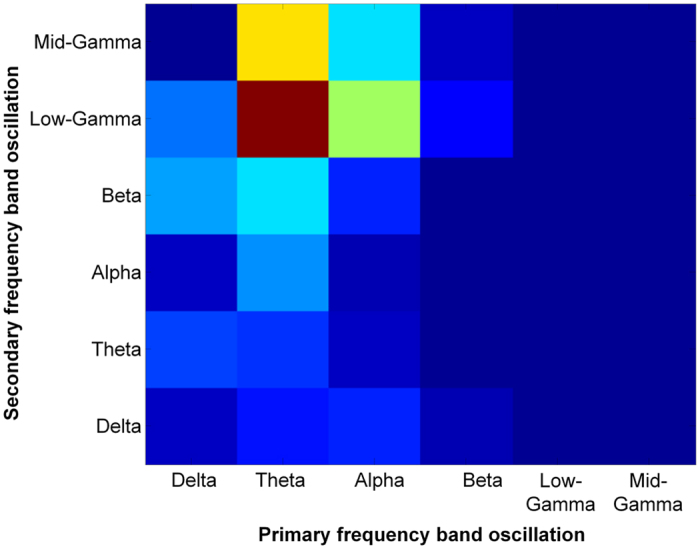
Preference distribution analysis for determining the optimal combination of the primary and secondary frequency bands that extract as much information as possible from each speech sample. Theta (4~10 Hz) as the primary frequency band oscillation and low gamma (25~35 Hz) as the secondary frequency band oscillation were chosen as the optimal combination for the temporal reference.