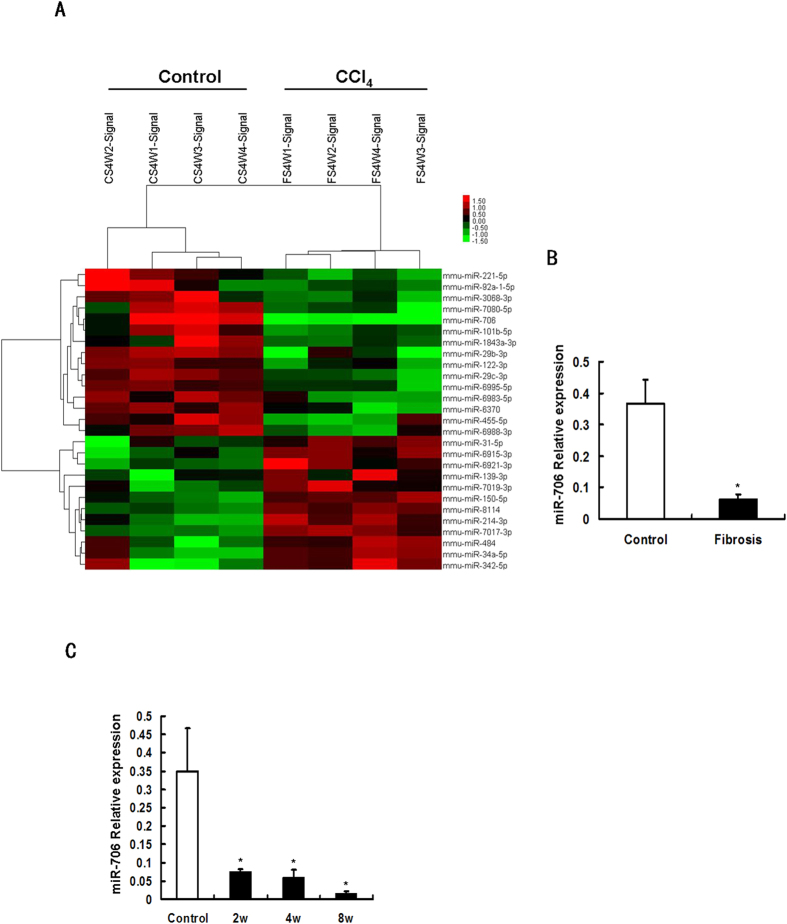
Figure 1. miR-706 is downregulated during liver fibrosis.
(A) MicroRNA (miRNA) expression was dysregulated in 4-week CCl4-treated liver, detected by miRNA microarray. Both down- and upregulated miRNAs were identified in the liver. The expression of miRNAs is hierarchically clustered on the y axis, and samples are hierarchically clustered on the x axis. The legend on the right indicates miRNAs. Relative expression of miRNAs is depicted according to the color scale shown on the top left. Red indicates upregulation and green indicates downregulation. (B) Validation of the miR-706 microarray data by RT-PCR analysis of DNase-I-treated total RNA. RNAs from 4 mice were used for RT-PCR and each sample was analyzed in triplicate. *P < 0.05. (C) miR-706 levels were reduced in 2, 4, and 8 weeks of CCl4 treatment compared to control tissue and analyzed by real-time PCR, *P < 0.05, n = 4 in each group. Data are expressed as mean ± SEM.

