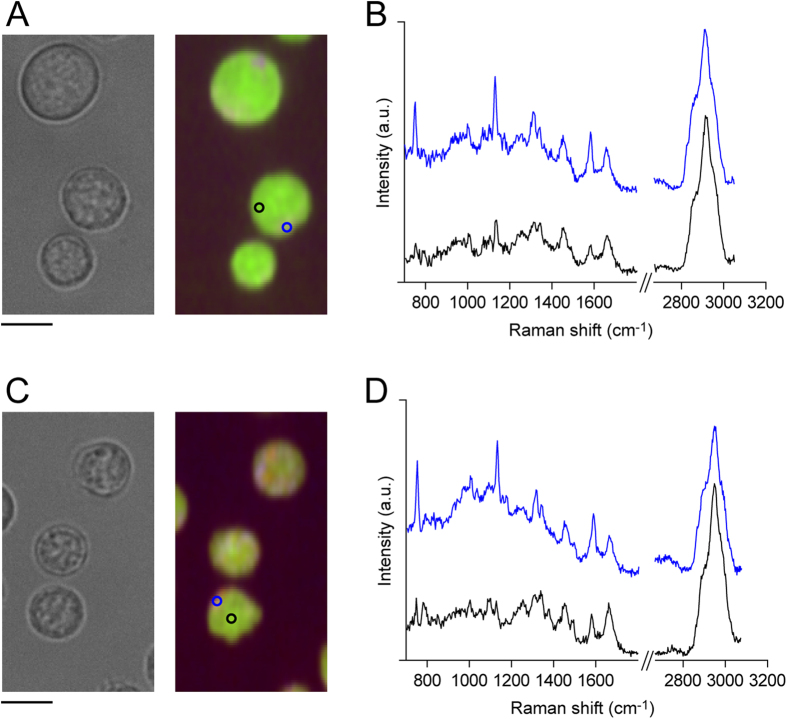
Figure 1. Raman images of T cells and B cells.
(A,C) Bright field (left panel) and Raman images (right panel) of T cells (A) and B cells (C). Raman peaks at 753 cm−1 (cytochrome C), 2956 cm−1 (proteins), and 2852 (lipids) cm−1 are mapped in blue, green, and red, respectively. Scale bar, 5 μm. (B,D) Raman spectrum of a T cell (B) and B cell (D) obtained from the cytosolic region (blue) and the nuclear region (black). Raman spectra were obtained from the blue (cytosol) and black (nucleus) regions indicated in Raman images. The silent region (1800–2700 cm−1) is omitted from the graph.

