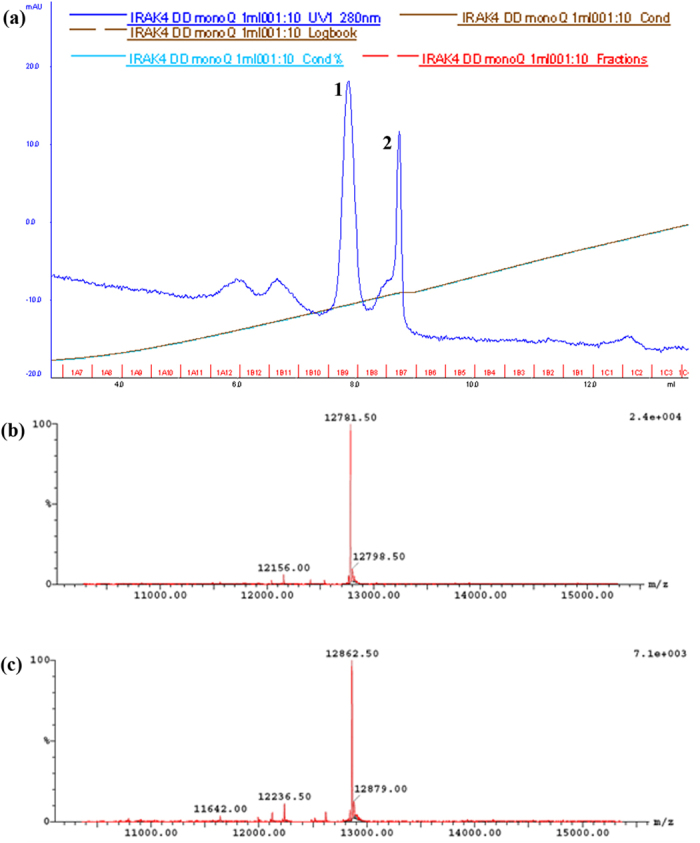
Figure 2. Separation of singly phosphorylated Ser8 IRAK-4 death domain.

(a) Absorbance elution spectrum at 280 nm of IRAK-4 DD using a monoQ anion exchange column. Peaks 1 and 2 eluted at approximately 70 mM and 120 mM NaCl respectively. (b) LC/MS spectrum showing deconvoluted masses of IRAK-4 death domain corresponding to peak 1 fraction. The mass of 12782 Da is non-phosphorylated IRAK-4 death domain residues (−7) to 107. (c) LC/MS spectrum showing deconvoluted masses of IRAK-4 death domain corresponding to peak 2. The mass of 12863 Da corresponded to singly phosphorylated IRAK-4 death domain residues (−7) to 107.
