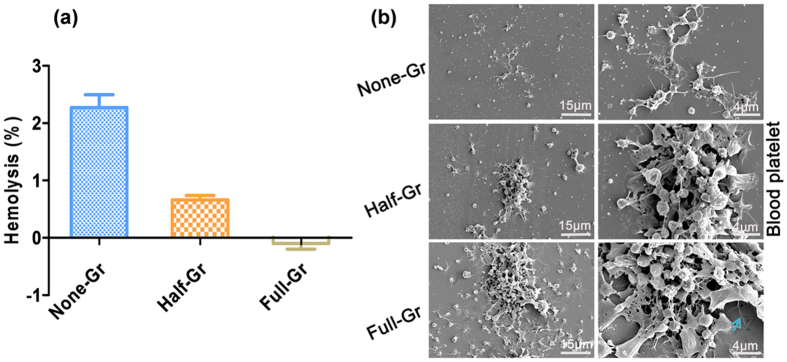
Figure 5.
(a) Hemolysis rate vs the graphene coverage when contacting with fresh blood; (b) Typical blood platelet adhesion morphology on the surface with variable graphene coverages area after incubating for 1 h at low (left panel) and high magnification (right panel), blue arrow indicate the wrinkle.

