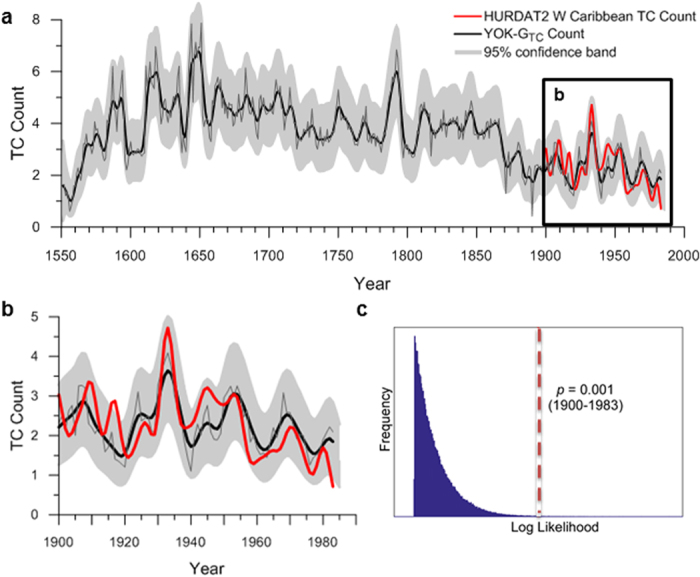
Figure 1. The YOK-GTC reconstruction and observational record calibration.

(a) The smoothed (black curve) and unsmoothed (grey curve) YOK-GTC reconstruction back to 1550 A.D. (b) Modern calibration with the HURDAT2 western Caribbean TC count (red curve) from 1900 to 1983. Shading in a and b indicates the 95% confidence band. (c) Histogram of the log likelihood values versus frequency. The dashed red line represents the log likelihood (probability) that the actual data correlates with the HURDAT2 western Caribbean TC count by chance (p = 0.001).
