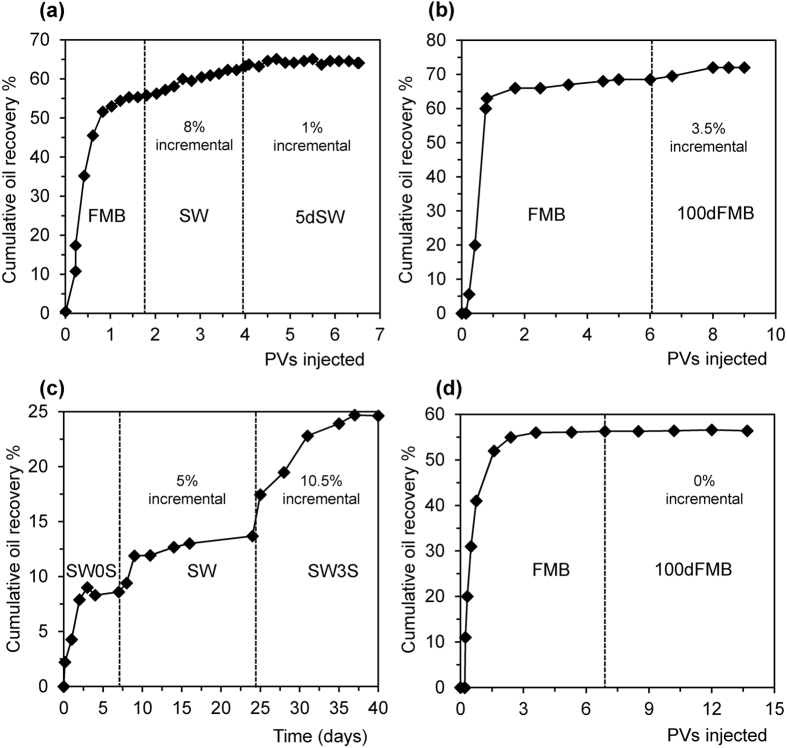
Figure 1.
Examples of (a,b,c) successful and (d) unsuccessful controlled salinity experiments in carbonates. Plots (a), (b) and (d) show core-flooding experiments (data from ref. 15 (a) and ref. 20 (b,d)). Plot (c) shows a spontaneous imbibition (SI) experiment (data from ref. 21). FMB denotes formation brine, SW denotes seawater, 100dFMB denotes formation brine diluted 100 times; 5dSW denotes seawater diluted 5 times; SW0S denotes seawater with SO42− removed; SW3S denotes seawater with SO42− increased by a factor of 3. Time in plots (a,b,d) is denoted in dimensionless pore-volumes (PV) injected.

