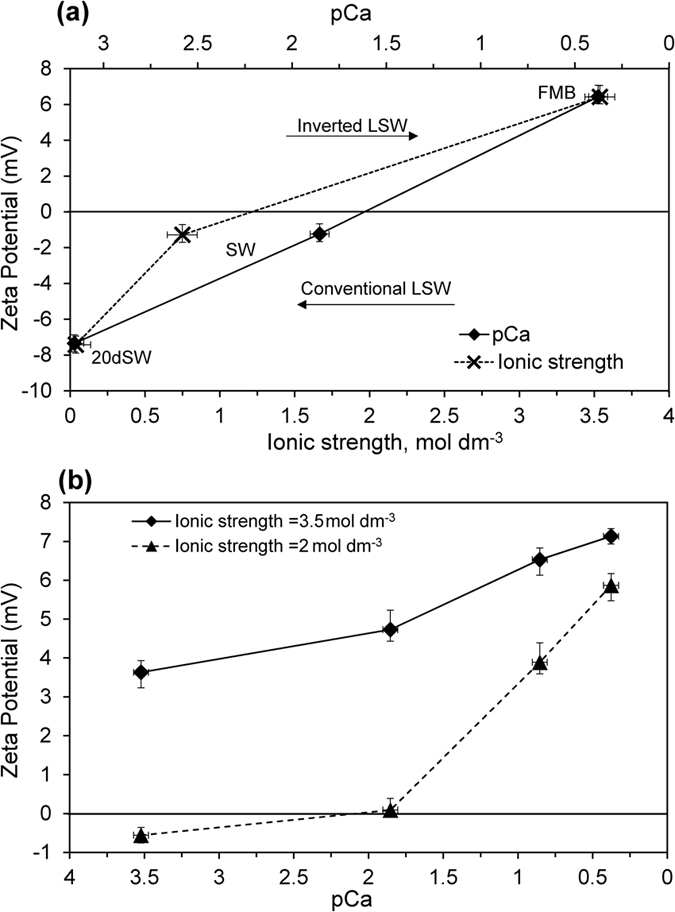
Figure 2. Impact of brine composition on the zeta potential of water-wet carbonate samples.

(a) Effect of varying composition from formation brine (FMB) to seawater (SW) to dilute seawater (dSW). Data are plotted against ionic strength on the lower horizontal axis and pCa on the upper horizontal axis, where p represents the negative logarithm. (b) Effect of varying calcium concentration at two different values of (constant) total ionic strength (2 mol·dm−3 and 3.5 mol·dm−3 comparable to FMB). Data are plotted against pCa.
