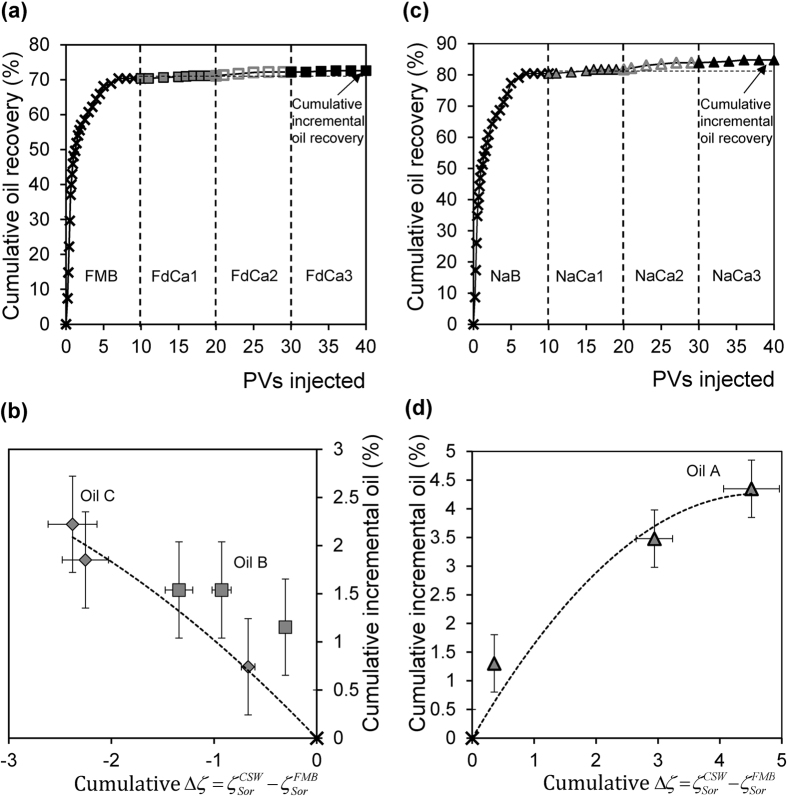
Figure 5. Effect of decreasing/increasing Ca concentration on oil recovery and zeta potential change.
(a) and (c) show examples of incremental recovery when (a) Ca is removed during water-flooding of Crude Oil B and (c) Ca is added during water-flooding of Crude Oil A. Vertical dashed lines in (a,c) indicate when streaming potential measurements are conducted. (b and d) show the relationship between incremental oil recovered and the incremental change in the zeta potential when (b) Ca is removed during water-flooding of Crude Oils B and C, and (d) Ca is added during water-flooding of Crude Oil A.

