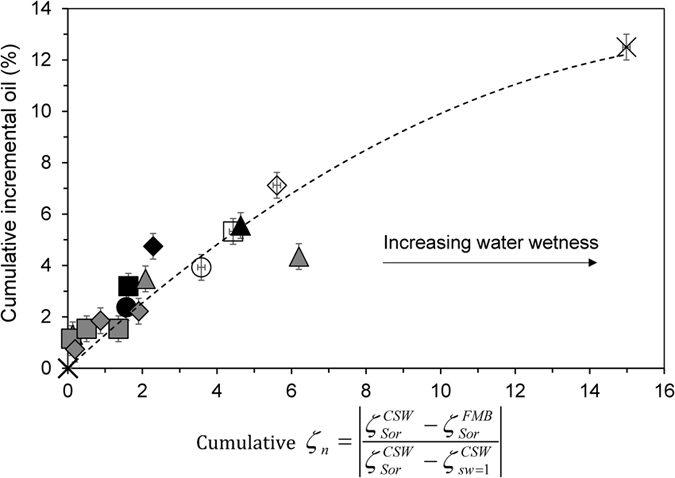
Figure 6. Cumulative incremental oil recovery against cumulative normalised zeta potential for all the CSW experiments showing incremental recovery.

Cross shows data in FMB; filled symbols show data in SW and empty symbols show data in 20dSW. Grey symbols show results of decreasing Ca2+ (squares for Oil B and diamonds for Oil C) and increasing Ca2+ (triangles for Oil A).
