
Figure 4. CSF sTREM2 levels in cognitively normal SNAPs and in MCI‐noAD .
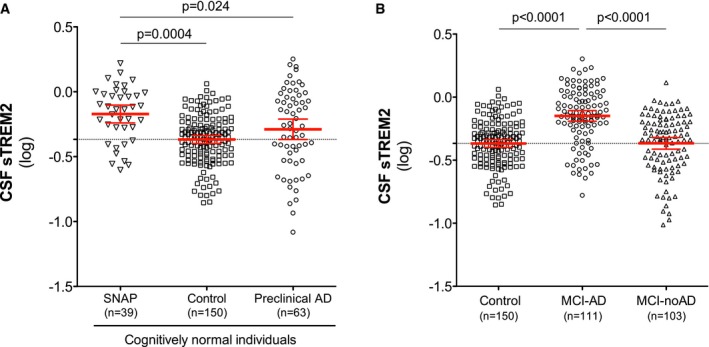
- Scatter plot showing CSF sTREM2 levels across different groups of cognitively normal individuals: SNAP, suspected non‐AD pathophysiology (n = 39); control subjects (n = 150); and preclinical AD (n = 63).
- Differences in CSF sTREM2 in MCI‐AD (n = 111) compared to MCI‐noAD (n = 103) and controls (n = 150).