
Fig. 1.
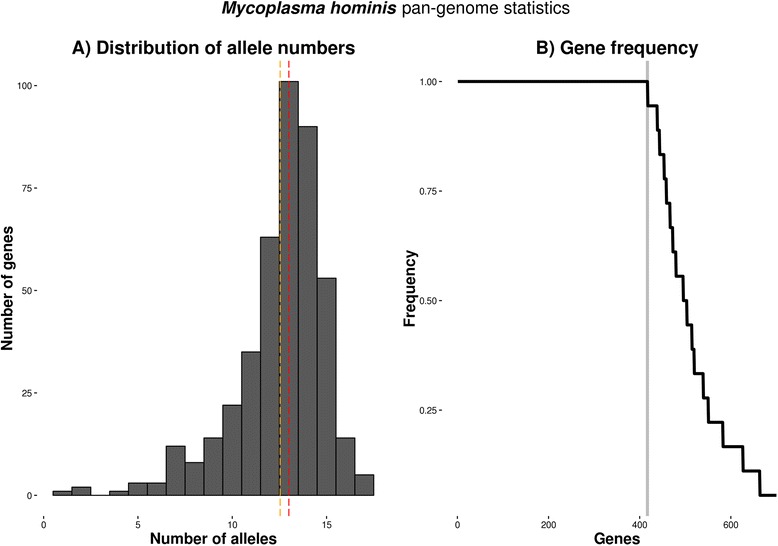
Mycoplasma hominis pan-genome statistics: a: Allele frequency of the genes in the pan genome is distributed with median 3 alleles (red) and mean 12 alleles (yellow) ; lower peak corresponds to conserved genes (low allele count), higher peak corresponds to genes with many different alleles. b: Gene frequency across all samples in the pan-genome. Grey line indicates the core number of genes appearing in all clinical strains and reference strain ATCC 27545 at least once (417)