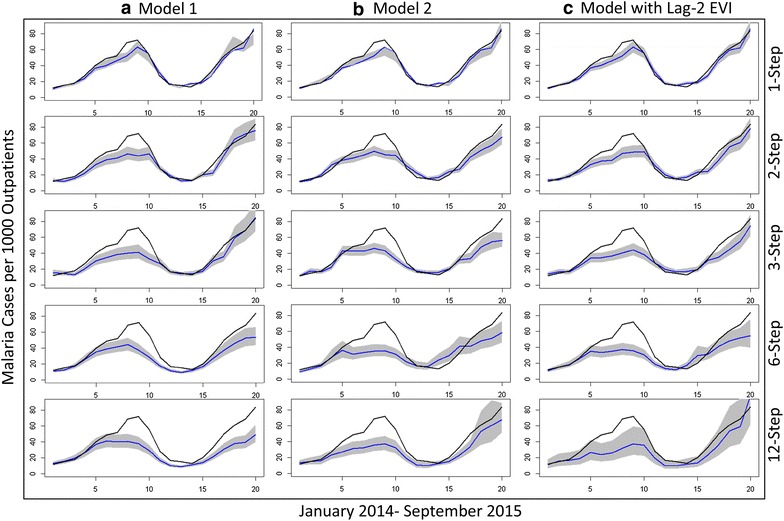
Fig. 4.

Out-of-sample prediction of different models. Columns (Left to right): a Model 1, b Model 2, and c Model 2 with enhanced vegetation index (EVI) at a lag of 2 months. The rows (from top to bottom) show 1-, 2-, 3-, 6-, and 12-ahead predictions. The black lines represent the observed adjusted time series data, while the blue lines represent the predicted values and the grey regions correspond to 95% prediction intervals
