Fig. 2.

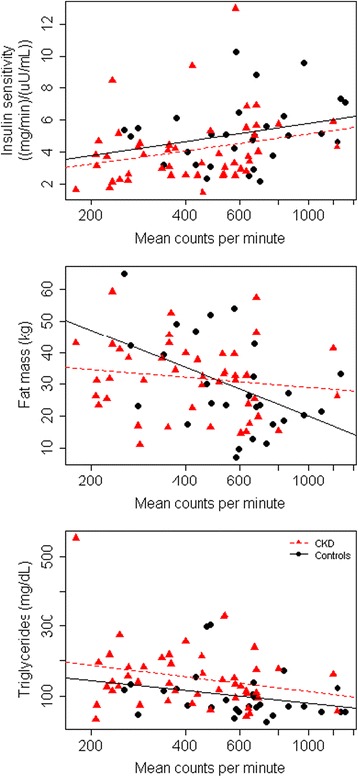
Correlations of physical activity measured by accelerometry with metrics of metabolic health. Scatter plots with linear regression lines stratified by CKD status. Controls are indicated in red and controls in black

Correlations of physical activity measured by accelerometry with metrics of metabolic health. Scatter plots with linear regression lines stratified by CKD status. Controls are indicated in red and controls in black