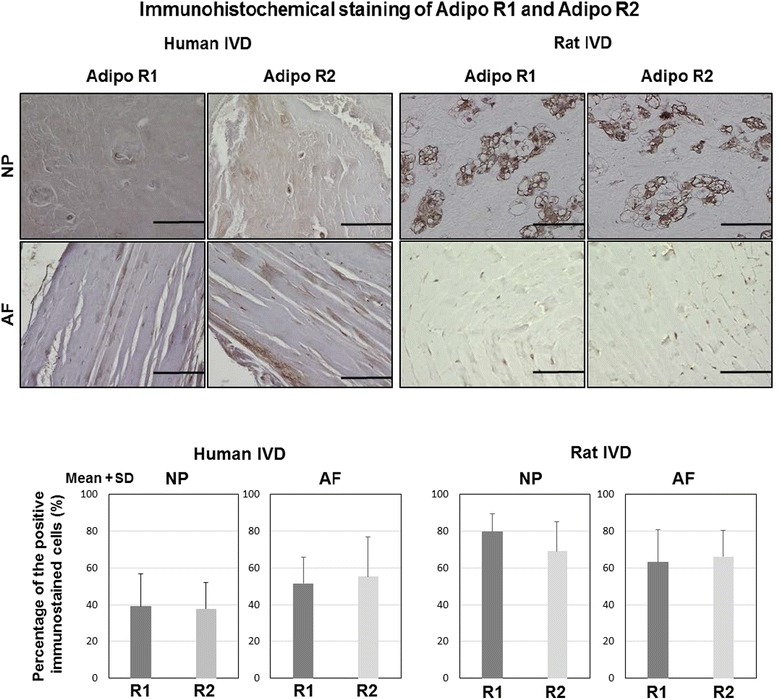
Fig. 2.

Immunohistochemical staining of AdipoR1 and AdipoR2 in human and rat IVDs. (Top) Photomicrographs demonstrating immunohistochemical localization of AdipoR1 and AdipoR2 in both NP and AF: bars = 100 μm. (Bottom) Percentage (%) of positive immunostained cells. Data were obtained from human IVD (N = 4) and rat IVD (N = 4), and expression is shown as mean + SD. R1 AdipoR1, R2 AdipoR2
