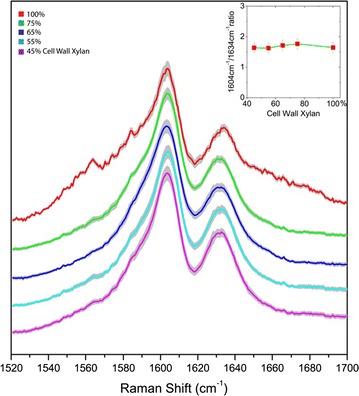
Fig. 2.

Comparison of lignin’s signature Raman peaks at 1604 and 1634 cm−1 in deacetylated corn stover cell walls with varying amounts of xylan content due to controlled xylanase digestion of xylan. The gray traces indicate the standard deviations. The two lignin signature Raman bands are unaltered even upon removal of significant amounts of cell wall xylan. The inset shows the peak ratio of 1604/1634 cm−1, which remains constant across wide ranges of xylan digestion. All spectrums are normalized
