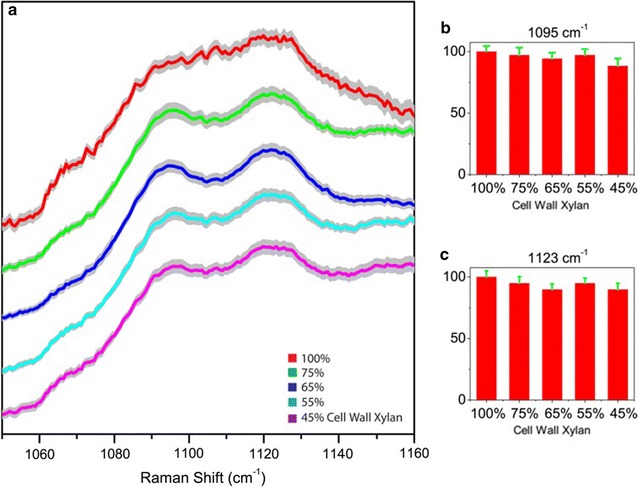
Fig. 3.

Comparison of cellulose’s signature Raman peaks at 1095 and 1123 cm−1 in deacetylated corn stover cell walls with varying amounts of xylan content due to controlled xylanase digestion of xylan. a Raman spectra show little change. b, c The peak heights of 1095 and 1123 cm−1 in cell walls remain constant with varying amounts of cell wall xylan content. All spectrums are normalized. The gray traces indicate the standard deviations
